OPEN-SOURCE SCRIPT
RTH Previous Day Levels | VAH VAL POC PDH PDL
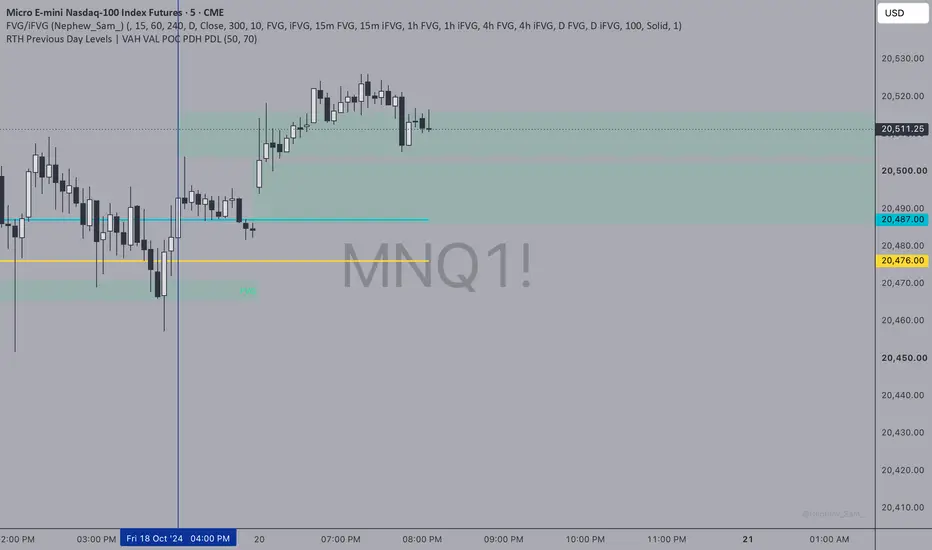
# Previous Day RTH Levels | VAH, VAL, POC, PDH & PDL
This indicator automatically plots five key price levels from the previous trading day's Regular Trading Hours (RTH) session, helping traders identify important areas of support, resistance, liquidity, and potential price acceptance or rejection.
Designed primarily for Nasdaq futures (NQ/MNQ), the indicator uses the New York RTH session (9:30 AM–4:00 PM ET).
### Key Features
- **PDH (Previous Day High):** The highest price reached during the previous RTH session.
- **PDL (Previous Day Low):** The lowest price reached during the previous RTH session.
- **VAH (Value Area High):** The upper boundary of the calculated value area.
- **VAL (Value Area Low):** The lower boundary of the calculated value area.
- **POC (Point of Control):** The price level with the highest estimated trading volume.
### Customization
- Individually enable or disable all five levels.
- Adjust volume profile resolution.
- Customize the value area percentage (70% default).
- Automatically updates levels for each new trading session.
### Trading Applications
Useful for identifying liquidity sweeps, breakouts, reversals, support and resistance, and price acceptance or rejection around previous-session levels.
### Important Notes
Volume profile levels are calculated using an estimated distribution of candle volume across price ranges. Results may differ from TradingView's built-in Volume Profile tools.
Designed for intraday charts, particularly the 5-minute timeframe.
**Disclaimer:** This indicator is intended for educational and technical analysis purposes only. It does not generate buy or sell signals and should not be considered financial advice.
This indicator automatically plots five key price levels from the previous trading day's Regular Trading Hours (RTH) session, helping traders identify important areas of support, resistance, liquidity, and potential price acceptance or rejection.
Designed primarily for Nasdaq futures (NQ/MNQ), the indicator uses the New York RTH session (9:30 AM–4:00 PM ET).
### Key Features
- **PDH (Previous Day High):** The highest price reached during the previous RTH session.
- **PDL (Previous Day Low):** The lowest price reached during the previous RTH session.
- **VAH (Value Area High):** The upper boundary of the calculated value area.
- **VAL (Value Area Low):** The lower boundary of the calculated value area.
- **POC (Point of Control):** The price level with the highest estimated trading volume.
### Customization
- Individually enable or disable all five levels.
- Adjust volume profile resolution.
- Customize the value area percentage (70% default).
- Automatically updates levels for each new trading session.
### Trading Applications
Useful for identifying liquidity sweeps, breakouts, reversals, support and resistance, and price acceptance or rejection around previous-session levels.
### Important Notes
Volume profile levels are calculated using an estimated distribution of candle volume across price ranges. Results may differ from TradingView's built-in Volume Profile tools.
Designed for intraday charts, particularly the 5-minute timeframe.
**Disclaimer:** This indicator is intended for educational and technical analysis purposes only. It does not generate buy or sell signals and should not be considered financial advice.
開源腳本
秉持TradingView一貫精神,這個腳本的創作者將其設為開源,以便交易者檢視並驗證其功能。向作者致敬!您可以免費使用此腳本,但請注意,重新發佈代碼需遵守我們的社群規範。

免責聲明
這些資訊和出版物並非旨在提供,也不構成TradingView提供或認可的任何形式的財務、投資、交易或其他類型的建議或推薦。請閱讀使用條款以了解更多資訊。
開源腳本
秉持TradingView一貫精神,這個腳本的創作者將其設為開源,以便交易者檢視並驗證其功能。向作者致敬!您可以免費使用此腳本,但請注意,重新發佈代碼需遵守我們的社群規範。
免責聲明
這些資訊和出版物並非旨在提供,也不構成TradingView提供或認可的任何形式的財務、投資、交易或其他類型的建議或推薦。請閱讀使用條款以了解更多資訊。