OPEN-SOURCE SCRIPT
已更新 Keltner | Bollinger | Squeeze
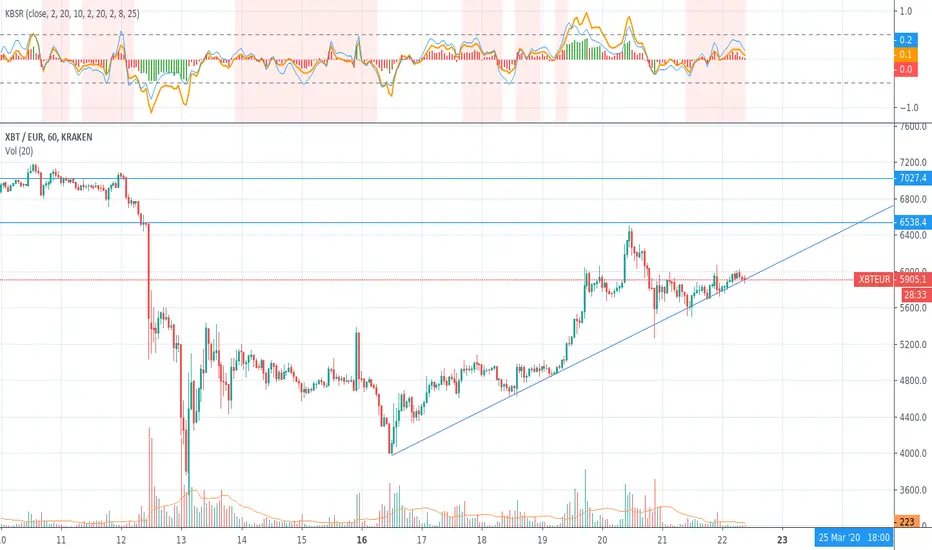
Percent B (%B), it's derivation Percent K (%K) and squeeze indicator combined in one.
blue line = bollinger %
orange line = keltner %
red background = squeeze*
squeeze = bollinger bands are inside (encapsulated by) keltner channel
blue line = bollinger %
orange line = keltner %
red background = squeeze*
squeeze = bollinger bands are inside (encapsulated by) keltner channel
發行說明
Fixed squeeze calculation.發行說明
Added scaled RSI indicator - let's call it rsi_2 - which is calculated in following way:> rsi_2 = (rsi / 100) - 0.5
RSI is now plotted as histogram, where
- green color = overbought / oversold market
- red color = normal
* This indicator was created primarly for my own purposes, all comments and suggestions are welcome.
發行說明
Added smoothing parameter to %B and %K.Note: Indicator works best with 30min+ time-frames.
開源腳本
秉持TradingView一貫精神,這個腳本的創作者將其設為開源,以便交易者檢視並驗證其功能。向作者致敬!您可以免費使用此腳本,但請注意,重新發佈代碼需遵守我們的社群規範。

免責聲明
這些資訊和出版物並非旨在提供,也不構成TradingView提供或認可的任何形式的財務、投資、交易或其他類型的建議或推薦。請閱讀使用條款以了解更多資訊。
免責聲明
這些資訊和出版物並非旨在提供,也不構成TradingView提供或認可的任何形式的財務、投資、交易或其他類型的建議或推薦。請閱讀使用條款以了解更多資訊。