OPEN-SOURCE SCRIPT
Alishba 02 [CLEVER] RSI Elite Toolkit
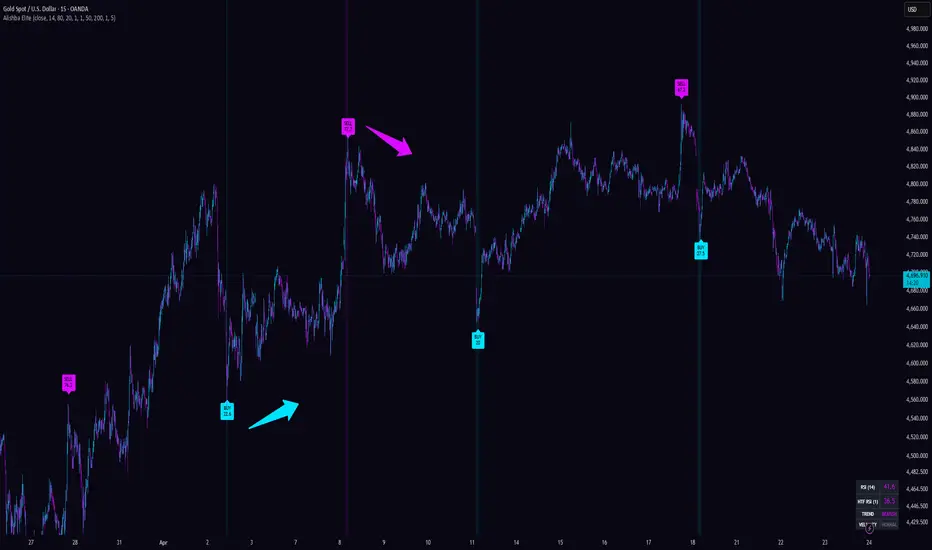
📌 Overview
Alishba 02 – RSI Elite Toolkit is a multi-layered analytical indicator developed to study momentum behavior and contextual price structure through a combination of Relative Strength Index (RSI) dynamics and rule-based filtering conditions. The script is designed to move beyond single-indicator signaling by integrating multiple complementary factors into a unified framework.
At its foundation, the indicator uses RSI to monitor momentum extremes and detect transitions out of overbought and oversold regions. Rather than treating these zones as standalone signals, the script interprets them as potential areas of interest where momentum conditions may be shifting. Signal generation is therefore based on the interaction between RSI level transitions and additional contextual filters.
To provide directional context, the indicator incorporates a trend-filtering mechanism based on exponential moving averages. This allows signals to be optionally aligned with prevailing market structure, helping distinguish between counter-trend reactions and trend-supported conditions. In parallel, a higher timeframe RSI component is used to introduce broader market context, enabling users to compare local momentum conditions with a larger timeframe perspective.
Beyond directional filtering, the script evaluates the internal characteristics of RSI movement. A velocity-based condition measures the rate of change in RSI values to approximate momentum intensity, while a depth-based condition tracks how far RSI extends into extreme zones before reversal behavior occurs. These two elements are used together to differentiate between standard signals and stronger multi-condition setups where multiple criteria align simultaneously.
To address signal frequency and reduce clustering during consolidating or low-volatility phases, the indicator includes a configurable cooldown mechanism. This enforces a minimum spacing between signals, helping maintain clarity and preventing excessive repetition of similar conditions within short intervals.
From a usability standpoint, the script provides optional visual elements including background zone highlighting and trend overlays, along with a compact dashboard summarizing key internal states such as RSI value, higher timeframe context, trend condition, and momentum intensity. These components are designed to support quick situational awareness without overwhelming the chart.
Overall, the RSI Elite Toolkit functions as a structured decision-support system that organizes multiple layers of market information into a consistent rule set. It is intended to assist in identifying areas where momentum, structure, and context may align, while leaving final interpretation and trade decisions to the user.
📌 Core Concept Overview
Alishba 02 – RSI Elite Toolkit is a structured, multi-layer analytical framework designed to interpret market momentum through a combination of RSI behavior, trend structure, and higher timeframe context. The core philosophy of the system is that no single indicator condition is sufficient on its own; instead, meaningful signals emerge only when multiple independent factors align simultaneously. This approach transforms RSI from a simple oscillator into a contextual decision component within a broader analytical model.
🔹 RSI Transition-Based Momentum Logic
At the foundation of the system lies the interpretation of RSI as a momentum transition tool rather than a fixed-level signal generator. Instead of treating overbought and oversold zones as direct buy or sell triggers, the script focuses on the movement out of these zones. These transitions are considered potential points where market behavior may shift from exhaustion to continuation or from continuation to reversal. This makes the logic more adaptive, as it reacts to changes in momentum rather than static threshold conditions.
🔹 Trend Structure Context (Directional Filtering)
To prevent isolated or misleading RSI signals, the system integrates a trend structure filter based on exponential moving averages. This layer defines whether the market is generally in an upward, downward, or neutral phase. Signals generated by RSI are optionally validated against this structure, ensuring that entries are aligned with broader market direction when enabled. This reduces the probability of taking signals in structurally weak or conflicting market conditions, improving contextual reliability.
🔹 Higher Timeframe Momentum Alignment
A higher timeframe RSI component is used to introduce macro-level context into micro-level decision-making. This filter compares local RSI behavior with a broader timeframe trend to determine whether short-term momentum is aligned with overall market direction. When enabled, this layer acts as a confirmation mechanism that helps distinguish between isolated price movements and structurally supported momentum shifts, improving directional consistency across timeframes.
🔹 Momentum Intensity and Velocity Analysis
The system includes a velocity-based momentum evaluation, which measures the rate of change in RSI values over time. This helps identify whether market movement is accelerating or slowing down at the point of signal generation. Rapid changes in RSI indicate strong momentum pressure, while slower movements suggest consolidation or weakening strength. This layer adds depth to signal interpretation by focusing not just on direction, but also on the intensity of movement.
🔹 Extreme Zone Depth Evaluation
In addition to velocity, the indicator analyzes how deeply RSI has previously extended into extreme zones. This concept is based on the idea that deeper movements into overbought or oversold regions often reflect stronger emotional or impulsive market conditions. When RSI reaches extreme depth and begins to reverse or stabilize, it can indicate potential exhaustion zones. This layer helps distinguish between minor pullbacks and structurally significant shifts in momentum behavior.
🔹 Signal Frequency Control (Cooldown Mechanism)
To maintain clarity and avoid excessive signal clustering, the system applies a cooldown-based execution filter. This mechanism restricts how frequently signals can be generated within a given period. The purpose is to reduce noise during sideways or choppy market conditions where multiple small fluctuations may otherwise trigger repetitive signals. By enforcing spacing between signals, the system ensures that each output represents a more meaningful change in market conditions.
🔹 Confluence-Based Decision Framework
The final output of the system is built on a confluence model, where multiple independent conditions must align before a signal is confirmed. These include RSI transitions, trend structure alignment, higher timeframe confirmation, momentum velocity, and extreme zone behavior. Only when several of these elements agree does the system generate a signal, ensuring that outputs are based on structured agreement between different analytical layers rather than a single condition.
🧠 Overall System Philosophy
The core philosophy of Alishba 02 – RSI Elite Toolkit is to transform raw indicator data into a structured decision-making framework. Instead of predicting price direction directly, the system organizes market behavior into layered conditions that highlight moments of alignment between momentum, structure, and context. This approach supports more disciplined analysis by focusing on confluence rather than isolated signals.
🔑 Key Features
Alishba 02 – RSI Elite Toolkit is designed as a structured multi-condition analysis system that combines momentum, trend structure, and contextual filters to highlight meaningful market conditions. Each feature works as an independent layer, and only when multiple layers align does the system generate a signal.
🔹 RSI-Based Momentum Transition Signals
The core feature of the system is its RSI transition logic, which focuses on movements out of overbought and oversold zones. Instead of treating these zones as fixed buy or sell points, the indicator interprets them as areas where momentum behavior may shift. Signals are generated when RSI crosses back from these zones, representing potential changes in short-term market pressure.
🔹 Trend Structure Filtering (EMA-Based Context)
The system optionally includes a trend filter based on exponential moving averages. This feature helps define whether the market is in an upward or downward structural phase. When enabled, signals are evaluated within this directional context, allowing users to focus only on conditions that align with broader market movement and avoid signals that occur against dominant structure.
🔹 Higher Timeframe Momentum Confirmation
A higher timeframe RSI filter is included to provide broader market context. This feature compares local RSI behavior with a larger timeframe trend to determine whether short-term momentum aligns with overall market direction. It helps reduce isolated or weak signals by requiring confirmation from a higher timeframe perspective when activated.
🔹 Momentum Strength Measurement (Velocity Analysis)
The indicator includes a velocity-based feature that measures the rate of change in RSI values. This helps identify whether momentum is accelerating or slowing down at the point of signal formation. Strong and fast RSI movement suggests active market pressure, while slower changes indicate consolidation or reduced momentum intensity.
🔹 Extreme Zone Depth Detection
This feature evaluates how deeply RSI has previously entered overbought or oversold zones before reversing. Deeper movements into these zones often reflect stronger emotional or extended market conditions. When RSI exits from such deep levels, it can indicate potential exhaustion or stronger reaction zones, which are treated with higher significance in signal evaluation.
🔹 Signal Cooldown System
To maintain clarity and reduce repetitive signals, the toolkit includes a cooldown mechanism that limits how frequently signals can occur. This ensures that signals are spaced out and only appear after sufficient market movement has taken place, reducing noise during sideways or choppy conditions.
🔹 Signal Strength Classification
The system categorizes signals into standard and stronger setups based on condition alignment. When multiple factors such as trend direction, higher timeframe confirmation, momentum velocity, and depth conditions align together, the signal is classified as a stronger setup. This classification helps users distinguish between basic transitions and higher-quality confluence conditions.
🔹 Optional Visual Structure Tools
The indicator includes optional visual components such as trend overlays, background zone highlighting, and a performance dashboard. These elements provide a structured overview of market conditions, including RSI value, trend state, momentum intensity, and higher timeframe alignment, helping users quickly interpret the current market context.
🧠 Overall Feature Philosophy
All features are designed around a confluence-based framework where no single condition is treated as sufficient on its own. Instead, each feature acts as a filtering layer that refines market information into structured signals. The goal is to support more disciplined analysis by combining momentum behavior, structural context, and confirmation logic into a unified system.
🧭 How to Use
Alishba 02 – RSI Elite Toolkit is a multi-layer analytical system designed to help interpret momentum shifts using structured confirmation logic. It is not intended to be used as a standalone prediction tool, but rather as a decision-support framework where signals are evaluated in context with trend, momentum, and higher timeframe conditions.
🔹 Step 1: Identify RSI Transition Signals
The first step is to observe RSI movement from overbought and oversold zones. The indicator generates signals when RSI crosses back from these extreme regions. These points represent potential shifts in short-term momentum. At this stage, the signal should not be treated in isolation; it is only the initial condition in a broader confirmation process.
🔹 Step 2: Check Market Trend Context
Before considering any signal, the trend condition should be evaluated. The system uses exponential moving averages to define whether the market is in an upward or downward structure. When trend filtering is enabled, signals aligned with the prevailing direction are considered more relevant, while opposite-direction signals may carry lower contextual strength.
🔹 Step 3: Confirm Higher Timeframe Direction
The next step is to compare local momentum with higher timeframe behavior. The higher timeframe RSI filter provides broader market context and helps determine whether the short-term signal is supported by overall market direction. When both timeframes are aligned, the signal context becomes more structured and stable.
🔹 Step 4: Evaluate Momentum Strength
The velocity component should be checked to understand the strength of the move. Rapid changes in RSI indicate strong momentum pressure, while slower changes suggest weaker or consolidating conditions. Stronger signals typically appear when momentum is active rather than flat or choppy.
🔹 Step 5: Observe Extreme Zone Depth
It is also important to consider how deeply RSI previously entered overbought or oversold conditions. Deeper movements often indicate stronger exhaustion phases. When signals occur after deep extensions, they may represent more significant reactions compared to shallow or minor fluctuations.
🔹 Step 6: Use Signal Strength Classification
The indicator differentiates between standard and stronger signals based on condition alignment. Strong signals appear when multiple factors such as trend direction, higher timeframe confirmation, momentum strength, and depth conditions align together. These signals represent higher confluence scenarios compared to basic transitions.
🔹 Step 7: Use Cooldown for Market Clarity
The cooldown system ensures that signals do not appear too frequently in short periods. This helps avoid noise during sideways or low-volatility conditions. It is important to respect this spacing, as closely repeated signals often represent minor fluctuations rather than meaningful structural changes.
🧠 Practical Usage Approach
In practical analysis, users should follow a step-by-step confirmation approach rather than reacting to every signal. First observe the RSI transition, then confirm trend structure, followed by higher timeframe alignment, and finally evaluate momentum and depth conditions. Only when multiple conditions agree should a signal be considered meaningful within the system framework.
⚠️ Important Note
This tool is designed for market structure analysis and decision support, not for direct trade execution. It should be used alongside broader market understanding, risk management, and additional analysis methods rather than in isolation.
⚙️ How It Works
Alishba 02 – RSI Elite Toolkit works as a multi-layer confirmation system that processes market data step-by-step instead of relying on a single indicator signal. The main idea is to filter raw RSI behavior through trend structure, higher timeframe context, momentum strength, and execution controls to highlight only more structured conditions.
🔹 Step 1: RSI Momentum Detection
The system first calculates RSI from price data and monitors its movement around overbought and oversold zones. A signal starts forming when RSI crosses back from these extreme areas. This represents a potential shift in short-term momentum behavior rather than a direct buy or sell instruction.
🔹 Step 2: Trend Structure Evaluation
After an RSI transition occurs, the system checks market direction using exponential moving averages. This defines whether the market is generally in an upward or downward structure. Signals are then interpreted in relation to this trend context, helping separate aligned conditions from opposing or unclear market phases.
🔹 Step 3: Higher Timeframe Confirmation
Next, the system evaluates a higher timeframe RSI value to understand broader market behavior. This step compares local momentum with a larger timeframe perspective. When both timeframes show similar directional bias, the signal context becomes more stable and structured.
🔹 Step 4: Momentum Strength Analysis
The toolkit measures how fast RSI is changing over time using a velocity calculation. This helps identify whether momentum is strong or weak at the point of signal generation. Stronger momentum indicates active market movement, while weaker momentum suggests consolidation or reduced pressure.
🔹 Step 5: Extreme Zone Depth Check
The system also checks how deeply RSI has previously entered extreme zones before reversing. Deep movements into overbought or oversold levels often reflect extended market pressure. When signals occur after such conditions, they are treated as more contextually significant compared to shallow movements.
🔹 Step 6: Signal Filtering and Cooldown Control
Before final output, signals pass through a filtering system that ensures all selected conditions are met. In addition, a cooldown mechanism prevents signals from appearing too frequently in short time periods. This helps reduce noise during sideways or unstable market conditions and ensures clearer signal spacing.
🔹 Step 7: Final Signal Formation
A final signal is generated only when multiple conditions align together. This includes RSI transition, trend structure, higher timeframe confirmation, momentum strength, and cooldown permission. If these conditions agree, the system produces either a standard or stronger classified signal based on the level of alignment.
🧠 Overall Working Principle
The indicator works on a confluence-based logic system, where each layer filters market data progressively. Instead of reacting to single events, it builds a structured interpretation of market conditions by combining momentum behavior, directional context, higher timeframe alignment, and execution rules into one unified framework.
⚠️ Key Understanding
This system does not predict market movement. It organizes available market data into structured conditions to help identify moments where multiple analytical factors temporarily align, improving clarity in decision-making.
⚙️ Settings & Customization
Alishba 02 – RSI Elite Toolkit is designed with flexible inputs so users can adjust sensitivity, filtering strength, and visual behavior according to different market conditions. The settings are organized into logical groups, allowing controlled customization without changing the core structure of the system.
🔹 RSI Configuration Settings
This section controls the core momentum detection behavior of the system. The RSI length determines how fast or slow the indicator reacts to price changes. A shorter length makes the system more sensitive to recent movements, while a longer length smooths signals and reduces noise.
Overbought and oversold levels define the extreme zones used for RSI transition detection. These levels are not direct trade signals but reference zones where momentum shifts are evaluated. Adjusting these levels changes how early or late the system reacts to market extremes.
Velocity and depth thresholds control how strictly momentum strength and exhaustion conditions are interpreted. A lower velocity threshold makes the system more responsive to small RSI changes, while a higher threshold focuses only on stronger momentum shifts. Depth settings define how far RSI must extend into extreme zones before reversal conditions are considered significant.
🔹 Trend Filter Settings (EMA Structure)
The trend filter section allows users to enable or disable directional market structure validation. When enabled, the system uses exponential moving averages to define whether the market is in an upward or downward phase.
The fast and slow EMA lengths can be customized to adjust trend sensitivity. Shorter EMA values respond quickly to price changes, while longer values provide smoother and more stable trend direction. This flexibility allows users to adapt the system for both fast-moving and slow-moving markets.
🔹 Higher Timeframe Filter Settings
This section controls broader market context through higher timeframe analysis. When enabled, the system compares local RSI behavior with a selected higher timeframe to ensure directional alignment.
The timeframe selection allows users to define the level of macro context they want to include. Lower higher timeframes provide faster confirmation, while higher timeframes offer broader structural perspective. This setting helps balance responsiveness with stability in signal validation.
🔹 Visual Appearance Settings
The visual section controls how information is displayed on the chart without affecting signal logic. Users can enable or disable performance dashboards, trend overlays, and background zone highlighting based on preference.
Color settings allow customization of buy, sell, and strong signal visuals to improve clarity and readability. These visual elements are designed to help users quickly interpret system output without affecting the underlying calculations.
🔹 Signal Cooldown Settings
The cooldown setting controls how frequently signals can appear. This prevents repeated signals during sideways or unstable market conditions. Increasing cooldown values reduces signal frequency and creates more spaced-out confirmations, while lower values allow faster signal generation.
This setting is useful for adapting the system to different trading styles, such as fast analysis versus more structured, slower decision-making approaches.
🧠 Customization Philosophy
All settings are designed to modify sensitivity and confirmation strength, not to change the core logic of the system. The indicator maintains a fixed analytical structure, while customization options allow users to adjust how strict or responsive the system behaves in different market environments.
⚠️ Important Note
Customization should be done carefully, as overly sensitive settings may increase noise, while overly strict settings may reduce signal frequency. The optimal configuration depends on market type, timeframe, and user preference, rather than a fixed universal setting.
⚠️ Multi-Indicator Mashup Explanation
Alishba 02 – RSI Elite Toolkit is built as a multi-factor analytical system, where each component serves a specific role in interpreting market behavior. Instead of relying on a single indicator signal, the system combines multiple independent conditions to create a more structured and context-aware output.
🔹 Why RSI is Used as the Core Trigger
The RSI component is used as the primary signal trigger because it reflects momentum strength and exhaustion conditions in price movement. In this system, RSI is not treated as a direct buy or sell tool. Instead, it is used to identify transitions when momentum moves out of overbought and oversold regions. These transitions represent potential shifts in short-term pressure rather than fixed directional signals.
🔹 Role of EMA Trend Filter
The EMA-based trend filter is included to define the overall market structure direction. It helps determine whether the market is generally moving upward, downward, or in a neutral phase. When enabled, this filter ensures that RSI-based signals are evaluated within the context of the prevailing trend, reducing the impact of signals that occur against broader market direction. This adds structural alignment to momentum-based conditions.
🔹 Role of Higher Timeframe Confirmation
The higher timeframe RSI component is used to provide broader market context beyond the current chart timeframe. It helps compare short-term momentum with larger-scale market behavior. When both timeframes show similar directional conditions, the signal is considered more contextually aligned. This layer helps reduce isolated signals that may not reflect the overall market environment.
🔹 Purpose of Velocity (Momentum Strength)
The velocity component measures the speed of RSI movement over time, which reflects momentum intensity. Rapid changes in RSI indicate stronger market pressure, while slower changes suggest weakening or consolidating conditions. This feature helps differentiate between strong directional moves and low-energy fluctuations, adding depth to signal interpretation.
🔹 Purpose of Depth (Extreme Condition Analysis)
The depth component evaluates how far RSI has previously extended into extreme zones before reversing. Deep movement into overbought or oversold levels often indicates extended market pressure or exhaustion conditions. This feature helps identify whether a signal is emerging from a minor fluctuation or from a more significant extended condition, improving contextual understanding of market behavior.
🔹 Role of Cooldown (Signal Control Layer)
The cooldown mechanism is included to control signal frequency and reduce repetition. It ensures that signals are not generated too frequently during short-term market fluctuations. This helps maintain clarity by spacing out signals and preventing noise during sideways or low-volatility conditions.
🧠 Overall Multi-Factor Logic
The system works by combining these components into a single structured framework. RSI provides the primary trigger, EMA defines directional structure, higher timeframe RSI adds broader context, velocity measures momentum strength, depth evaluates exhaustion conditions, and cooldown manages signal spacing. A signal is only considered valid when multiple conditions align together, rather than relying on a single indicator reading.
⚠️ Important Compliance Note
This is a multi-condition analytical system, and each component functions as a separate filter layer. The indicator does not guarantee outcomes or predict price direction; instead, it organizes market data into structured conditions to help identify moments where multiple factors align within a defined framework.
🧾 Final Notes (House Rules Safe)
Alishba 02 – RSI Elite Toolkit is a structured, multi-layer analytical framework designed to interpret market momentum through a combination of RSI behavior, trend structure, and higher timeframe context. The system is built on the principle that no single indicator condition should be treated in isolation, and that more meaningful signals emerge only when multiple independent factors align together.
This toolkit uses RSI transitions as the primary event trigger, focusing on movement out of overbought and oversold zones rather than fixed threshold interpretations. These transitions are then evaluated through additional layers such as trend structure, higher timeframe alignment, momentum strength, and extreme zone behavior to build a more complete view of market conditions.
Each component in the system serves a specific purpose: the trend filter provides directional context, the higher timeframe RSI adds broader market perspective, velocity measures momentum intensity, and depth analysis evaluates exhaustion conditions. A cooldown mechanism is also included to maintain clarity by preventing excessive signal repetition during low-volatility or sideways market phases.
Overall, this indicator is intended as a decision-support and market analysis tool rather than a predictive system. It helps organize price behavior into structured conditions where multiple factors are evaluated together to improve clarity in interpreting market momentum and potential shifts in behavior.
Trading decisions should always be made using proper risk management and additional analysis tools alongside this system, as no indicator can guarantee future market outcomes.
⚠️ Disclaimer (House Rules Safe)
Alishba 02 – RSI Elite Toolkit is a technical analysis tool designed to assist in studying market momentum, trend structure, and higher timeframe conditions. It is intended for informational and educational use only and should not be considered financial advice, investment advice, or a guarantee of trading results.
All signals generated by this indicator are based on historical price data and calculated conditions such as RSI behavior, trend alignment, and momentum filters. These signals represent potential areas of interest in market structure analysis but do not predict future price movements or ensure any specific outcome.
Users should be aware that financial markets involve risk and can result in losses. This tool should be used as part of a broader analysis process that includes proper risk management, independent judgment, and additional confirmation methods.
Past performance or signal behavior observed using this indicator does not guarantee similar results in the future. All trading decisions remain the sole responsibility of the user.
Alishba 02 – RSI Elite Toolkit is a multi-layered analytical indicator developed to study momentum behavior and contextual price structure through a combination of Relative Strength Index (RSI) dynamics and rule-based filtering conditions. The script is designed to move beyond single-indicator signaling by integrating multiple complementary factors into a unified framework.
At its foundation, the indicator uses RSI to monitor momentum extremes and detect transitions out of overbought and oversold regions. Rather than treating these zones as standalone signals, the script interprets them as potential areas of interest where momentum conditions may be shifting. Signal generation is therefore based on the interaction between RSI level transitions and additional contextual filters.
To provide directional context, the indicator incorporates a trend-filtering mechanism based on exponential moving averages. This allows signals to be optionally aligned with prevailing market structure, helping distinguish between counter-trend reactions and trend-supported conditions. In parallel, a higher timeframe RSI component is used to introduce broader market context, enabling users to compare local momentum conditions with a larger timeframe perspective.
Beyond directional filtering, the script evaluates the internal characteristics of RSI movement. A velocity-based condition measures the rate of change in RSI values to approximate momentum intensity, while a depth-based condition tracks how far RSI extends into extreme zones before reversal behavior occurs. These two elements are used together to differentiate between standard signals and stronger multi-condition setups where multiple criteria align simultaneously.
To address signal frequency and reduce clustering during consolidating or low-volatility phases, the indicator includes a configurable cooldown mechanism. This enforces a minimum spacing between signals, helping maintain clarity and preventing excessive repetition of similar conditions within short intervals.
From a usability standpoint, the script provides optional visual elements including background zone highlighting and trend overlays, along with a compact dashboard summarizing key internal states such as RSI value, higher timeframe context, trend condition, and momentum intensity. These components are designed to support quick situational awareness without overwhelming the chart.
Overall, the RSI Elite Toolkit functions as a structured decision-support system that organizes multiple layers of market information into a consistent rule set. It is intended to assist in identifying areas where momentum, structure, and context may align, while leaving final interpretation and trade decisions to the user.
📌 Core Concept Overview
Alishba 02 – RSI Elite Toolkit is a structured, multi-layer analytical framework designed to interpret market momentum through a combination of RSI behavior, trend structure, and higher timeframe context. The core philosophy of the system is that no single indicator condition is sufficient on its own; instead, meaningful signals emerge only when multiple independent factors align simultaneously. This approach transforms RSI from a simple oscillator into a contextual decision component within a broader analytical model.
🔹 RSI Transition-Based Momentum Logic
At the foundation of the system lies the interpretation of RSI as a momentum transition tool rather than a fixed-level signal generator. Instead of treating overbought and oversold zones as direct buy or sell triggers, the script focuses on the movement out of these zones. These transitions are considered potential points where market behavior may shift from exhaustion to continuation or from continuation to reversal. This makes the logic more adaptive, as it reacts to changes in momentum rather than static threshold conditions.
🔹 Trend Structure Context (Directional Filtering)
To prevent isolated or misleading RSI signals, the system integrates a trend structure filter based on exponential moving averages. This layer defines whether the market is generally in an upward, downward, or neutral phase. Signals generated by RSI are optionally validated against this structure, ensuring that entries are aligned with broader market direction when enabled. This reduces the probability of taking signals in structurally weak or conflicting market conditions, improving contextual reliability.
🔹 Higher Timeframe Momentum Alignment
A higher timeframe RSI component is used to introduce macro-level context into micro-level decision-making. This filter compares local RSI behavior with a broader timeframe trend to determine whether short-term momentum is aligned with overall market direction. When enabled, this layer acts as a confirmation mechanism that helps distinguish between isolated price movements and structurally supported momentum shifts, improving directional consistency across timeframes.
🔹 Momentum Intensity and Velocity Analysis
The system includes a velocity-based momentum evaluation, which measures the rate of change in RSI values over time. This helps identify whether market movement is accelerating or slowing down at the point of signal generation. Rapid changes in RSI indicate strong momentum pressure, while slower movements suggest consolidation or weakening strength. This layer adds depth to signal interpretation by focusing not just on direction, but also on the intensity of movement.
🔹 Extreme Zone Depth Evaluation
In addition to velocity, the indicator analyzes how deeply RSI has previously extended into extreme zones. This concept is based on the idea that deeper movements into overbought or oversold regions often reflect stronger emotional or impulsive market conditions. When RSI reaches extreme depth and begins to reverse or stabilize, it can indicate potential exhaustion zones. This layer helps distinguish between minor pullbacks and structurally significant shifts in momentum behavior.
🔹 Signal Frequency Control (Cooldown Mechanism)
To maintain clarity and avoid excessive signal clustering, the system applies a cooldown-based execution filter. This mechanism restricts how frequently signals can be generated within a given period. The purpose is to reduce noise during sideways or choppy market conditions where multiple small fluctuations may otherwise trigger repetitive signals. By enforcing spacing between signals, the system ensures that each output represents a more meaningful change in market conditions.
🔹 Confluence-Based Decision Framework
The final output of the system is built on a confluence model, where multiple independent conditions must align before a signal is confirmed. These include RSI transitions, trend structure alignment, higher timeframe confirmation, momentum velocity, and extreme zone behavior. Only when several of these elements agree does the system generate a signal, ensuring that outputs are based on structured agreement between different analytical layers rather than a single condition.
🧠 Overall System Philosophy
The core philosophy of Alishba 02 – RSI Elite Toolkit is to transform raw indicator data into a structured decision-making framework. Instead of predicting price direction directly, the system organizes market behavior into layered conditions that highlight moments of alignment between momentum, structure, and context. This approach supports more disciplined analysis by focusing on confluence rather than isolated signals.
🔑 Key Features
Alishba 02 – RSI Elite Toolkit is designed as a structured multi-condition analysis system that combines momentum, trend structure, and contextual filters to highlight meaningful market conditions. Each feature works as an independent layer, and only when multiple layers align does the system generate a signal.
🔹 RSI-Based Momentum Transition Signals
The core feature of the system is its RSI transition logic, which focuses on movements out of overbought and oversold zones. Instead of treating these zones as fixed buy or sell points, the indicator interprets them as areas where momentum behavior may shift. Signals are generated when RSI crosses back from these zones, representing potential changes in short-term market pressure.
🔹 Trend Structure Filtering (EMA-Based Context)
The system optionally includes a trend filter based on exponential moving averages. This feature helps define whether the market is in an upward or downward structural phase. When enabled, signals are evaluated within this directional context, allowing users to focus only on conditions that align with broader market movement and avoid signals that occur against dominant structure.
🔹 Higher Timeframe Momentum Confirmation
A higher timeframe RSI filter is included to provide broader market context. This feature compares local RSI behavior with a larger timeframe trend to determine whether short-term momentum aligns with overall market direction. It helps reduce isolated or weak signals by requiring confirmation from a higher timeframe perspective when activated.
🔹 Momentum Strength Measurement (Velocity Analysis)
The indicator includes a velocity-based feature that measures the rate of change in RSI values. This helps identify whether momentum is accelerating or slowing down at the point of signal formation. Strong and fast RSI movement suggests active market pressure, while slower changes indicate consolidation or reduced momentum intensity.
🔹 Extreme Zone Depth Detection
This feature evaluates how deeply RSI has previously entered overbought or oversold zones before reversing. Deeper movements into these zones often reflect stronger emotional or extended market conditions. When RSI exits from such deep levels, it can indicate potential exhaustion or stronger reaction zones, which are treated with higher significance in signal evaluation.
🔹 Signal Cooldown System
To maintain clarity and reduce repetitive signals, the toolkit includes a cooldown mechanism that limits how frequently signals can occur. This ensures that signals are spaced out and only appear after sufficient market movement has taken place, reducing noise during sideways or choppy conditions.
🔹 Signal Strength Classification
The system categorizes signals into standard and stronger setups based on condition alignment. When multiple factors such as trend direction, higher timeframe confirmation, momentum velocity, and depth conditions align together, the signal is classified as a stronger setup. This classification helps users distinguish between basic transitions and higher-quality confluence conditions.
🔹 Optional Visual Structure Tools
The indicator includes optional visual components such as trend overlays, background zone highlighting, and a performance dashboard. These elements provide a structured overview of market conditions, including RSI value, trend state, momentum intensity, and higher timeframe alignment, helping users quickly interpret the current market context.
🧠 Overall Feature Philosophy
All features are designed around a confluence-based framework where no single condition is treated as sufficient on its own. Instead, each feature acts as a filtering layer that refines market information into structured signals. The goal is to support more disciplined analysis by combining momentum behavior, structural context, and confirmation logic into a unified system.
🧭 How to Use
Alishba 02 – RSI Elite Toolkit is a multi-layer analytical system designed to help interpret momentum shifts using structured confirmation logic. It is not intended to be used as a standalone prediction tool, but rather as a decision-support framework where signals are evaluated in context with trend, momentum, and higher timeframe conditions.
🔹 Step 1: Identify RSI Transition Signals
The first step is to observe RSI movement from overbought and oversold zones. The indicator generates signals when RSI crosses back from these extreme regions. These points represent potential shifts in short-term momentum. At this stage, the signal should not be treated in isolation; it is only the initial condition in a broader confirmation process.
🔹 Step 2: Check Market Trend Context
Before considering any signal, the trend condition should be evaluated. The system uses exponential moving averages to define whether the market is in an upward or downward structure. When trend filtering is enabled, signals aligned with the prevailing direction are considered more relevant, while opposite-direction signals may carry lower contextual strength.
🔹 Step 3: Confirm Higher Timeframe Direction
The next step is to compare local momentum with higher timeframe behavior. The higher timeframe RSI filter provides broader market context and helps determine whether the short-term signal is supported by overall market direction. When both timeframes are aligned, the signal context becomes more structured and stable.
🔹 Step 4: Evaluate Momentum Strength
The velocity component should be checked to understand the strength of the move. Rapid changes in RSI indicate strong momentum pressure, while slower changes suggest weaker or consolidating conditions. Stronger signals typically appear when momentum is active rather than flat or choppy.
🔹 Step 5: Observe Extreme Zone Depth
It is also important to consider how deeply RSI previously entered overbought or oversold conditions. Deeper movements often indicate stronger exhaustion phases. When signals occur after deep extensions, they may represent more significant reactions compared to shallow or minor fluctuations.
🔹 Step 6: Use Signal Strength Classification
The indicator differentiates between standard and stronger signals based on condition alignment. Strong signals appear when multiple factors such as trend direction, higher timeframe confirmation, momentum strength, and depth conditions align together. These signals represent higher confluence scenarios compared to basic transitions.
🔹 Step 7: Use Cooldown for Market Clarity
The cooldown system ensures that signals do not appear too frequently in short periods. This helps avoid noise during sideways or low-volatility conditions. It is important to respect this spacing, as closely repeated signals often represent minor fluctuations rather than meaningful structural changes.
🧠 Practical Usage Approach
In practical analysis, users should follow a step-by-step confirmation approach rather than reacting to every signal. First observe the RSI transition, then confirm trend structure, followed by higher timeframe alignment, and finally evaluate momentum and depth conditions. Only when multiple conditions agree should a signal be considered meaningful within the system framework.
⚠️ Important Note
This tool is designed for market structure analysis and decision support, not for direct trade execution. It should be used alongside broader market understanding, risk management, and additional analysis methods rather than in isolation.
⚙️ How It Works
Alishba 02 – RSI Elite Toolkit works as a multi-layer confirmation system that processes market data step-by-step instead of relying on a single indicator signal. The main idea is to filter raw RSI behavior through trend structure, higher timeframe context, momentum strength, and execution controls to highlight only more structured conditions.
🔹 Step 1: RSI Momentum Detection
The system first calculates RSI from price data and monitors its movement around overbought and oversold zones. A signal starts forming when RSI crosses back from these extreme areas. This represents a potential shift in short-term momentum behavior rather than a direct buy or sell instruction.
🔹 Step 2: Trend Structure Evaluation
After an RSI transition occurs, the system checks market direction using exponential moving averages. This defines whether the market is generally in an upward or downward structure. Signals are then interpreted in relation to this trend context, helping separate aligned conditions from opposing or unclear market phases.
🔹 Step 3: Higher Timeframe Confirmation
Next, the system evaluates a higher timeframe RSI value to understand broader market behavior. This step compares local momentum with a larger timeframe perspective. When both timeframes show similar directional bias, the signal context becomes more stable and structured.
🔹 Step 4: Momentum Strength Analysis
The toolkit measures how fast RSI is changing over time using a velocity calculation. This helps identify whether momentum is strong or weak at the point of signal generation. Stronger momentum indicates active market movement, while weaker momentum suggests consolidation or reduced pressure.
🔹 Step 5: Extreme Zone Depth Check
The system also checks how deeply RSI has previously entered extreme zones before reversing. Deep movements into overbought or oversold levels often reflect extended market pressure. When signals occur after such conditions, they are treated as more contextually significant compared to shallow movements.
🔹 Step 6: Signal Filtering and Cooldown Control
Before final output, signals pass through a filtering system that ensures all selected conditions are met. In addition, a cooldown mechanism prevents signals from appearing too frequently in short time periods. This helps reduce noise during sideways or unstable market conditions and ensures clearer signal spacing.
🔹 Step 7: Final Signal Formation
A final signal is generated only when multiple conditions align together. This includes RSI transition, trend structure, higher timeframe confirmation, momentum strength, and cooldown permission. If these conditions agree, the system produces either a standard or stronger classified signal based on the level of alignment.
🧠 Overall Working Principle
The indicator works on a confluence-based logic system, where each layer filters market data progressively. Instead of reacting to single events, it builds a structured interpretation of market conditions by combining momentum behavior, directional context, higher timeframe alignment, and execution rules into one unified framework.
⚠️ Key Understanding
This system does not predict market movement. It organizes available market data into structured conditions to help identify moments where multiple analytical factors temporarily align, improving clarity in decision-making.
⚙️ Settings & Customization
Alishba 02 – RSI Elite Toolkit is designed with flexible inputs so users can adjust sensitivity, filtering strength, and visual behavior according to different market conditions. The settings are organized into logical groups, allowing controlled customization without changing the core structure of the system.
🔹 RSI Configuration Settings
This section controls the core momentum detection behavior of the system. The RSI length determines how fast or slow the indicator reacts to price changes. A shorter length makes the system more sensitive to recent movements, while a longer length smooths signals and reduces noise.
Overbought and oversold levels define the extreme zones used for RSI transition detection. These levels are not direct trade signals but reference zones where momentum shifts are evaluated. Adjusting these levels changes how early or late the system reacts to market extremes.
Velocity and depth thresholds control how strictly momentum strength and exhaustion conditions are interpreted. A lower velocity threshold makes the system more responsive to small RSI changes, while a higher threshold focuses only on stronger momentum shifts. Depth settings define how far RSI must extend into extreme zones before reversal conditions are considered significant.
🔹 Trend Filter Settings (EMA Structure)
The trend filter section allows users to enable or disable directional market structure validation. When enabled, the system uses exponential moving averages to define whether the market is in an upward or downward phase.
The fast and slow EMA lengths can be customized to adjust trend sensitivity. Shorter EMA values respond quickly to price changes, while longer values provide smoother and more stable trend direction. This flexibility allows users to adapt the system for both fast-moving and slow-moving markets.
🔹 Higher Timeframe Filter Settings
This section controls broader market context through higher timeframe analysis. When enabled, the system compares local RSI behavior with a selected higher timeframe to ensure directional alignment.
The timeframe selection allows users to define the level of macro context they want to include. Lower higher timeframes provide faster confirmation, while higher timeframes offer broader structural perspective. This setting helps balance responsiveness with stability in signal validation.
🔹 Visual Appearance Settings
The visual section controls how information is displayed on the chart without affecting signal logic. Users can enable or disable performance dashboards, trend overlays, and background zone highlighting based on preference.
Color settings allow customization of buy, sell, and strong signal visuals to improve clarity and readability. These visual elements are designed to help users quickly interpret system output without affecting the underlying calculations.
🔹 Signal Cooldown Settings
The cooldown setting controls how frequently signals can appear. This prevents repeated signals during sideways or unstable market conditions. Increasing cooldown values reduces signal frequency and creates more spaced-out confirmations, while lower values allow faster signal generation.
This setting is useful for adapting the system to different trading styles, such as fast analysis versus more structured, slower decision-making approaches.
🧠 Customization Philosophy
All settings are designed to modify sensitivity and confirmation strength, not to change the core logic of the system. The indicator maintains a fixed analytical structure, while customization options allow users to adjust how strict or responsive the system behaves in different market environments.
⚠️ Important Note
Customization should be done carefully, as overly sensitive settings may increase noise, while overly strict settings may reduce signal frequency. The optimal configuration depends on market type, timeframe, and user preference, rather than a fixed universal setting.
⚠️ Multi-Indicator Mashup Explanation
Alishba 02 – RSI Elite Toolkit is built as a multi-factor analytical system, where each component serves a specific role in interpreting market behavior. Instead of relying on a single indicator signal, the system combines multiple independent conditions to create a more structured and context-aware output.
🔹 Why RSI is Used as the Core Trigger
The RSI component is used as the primary signal trigger because it reflects momentum strength and exhaustion conditions in price movement. In this system, RSI is not treated as a direct buy or sell tool. Instead, it is used to identify transitions when momentum moves out of overbought and oversold regions. These transitions represent potential shifts in short-term pressure rather than fixed directional signals.
🔹 Role of EMA Trend Filter
The EMA-based trend filter is included to define the overall market structure direction. It helps determine whether the market is generally moving upward, downward, or in a neutral phase. When enabled, this filter ensures that RSI-based signals are evaluated within the context of the prevailing trend, reducing the impact of signals that occur against broader market direction. This adds structural alignment to momentum-based conditions.
🔹 Role of Higher Timeframe Confirmation
The higher timeframe RSI component is used to provide broader market context beyond the current chart timeframe. It helps compare short-term momentum with larger-scale market behavior. When both timeframes show similar directional conditions, the signal is considered more contextually aligned. This layer helps reduce isolated signals that may not reflect the overall market environment.
🔹 Purpose of Velocity (Momentum Strength)
The velocity component measures the speed of RSI movement over time, which reflects momentum intensity. Rapid changes in RSI indicate stronger market pressure, while slower changes suggest weakening or consolidating conditions. This feature helps differentiate between strong directional moves and low-energy fluctuations, adding depth to signal interpretation.
🔹 Purpose of Depth (Extreme Condition Analysis)
The depth component evaluates how far RSI has previously extended into extreme zones before reversing. Deep movement into overbought or oversold levels often indicates extended market pressure or exhaustion conditions. This feature helps identify whether a signal is emerging from a minor fluctuation or from a more significant extended condition, improving contextual understanding of market behavior.
🔹 Role of Cooldown (Signal Control Layer)
The cooldown mechanism is included to control signal frequency and reduce repetition. It ensures that signals are not generated too frequently during short-term market fluctuations. This helps maintain clarity by spacing out signals and preventing noise during sideways or low-volatility conditions.
🧠 Overall Multi-Factor Logic
The system works by combining these components into a single structured framework. RSI provides the primary trigger, EMA defines directional structure, higher timeframe RSI adds broader context, velocity measures momentum strength, depth evaluates exhaustion conditions, and cooldown manages signal spacing. A signal is only considered valid when multiple conditions align together, rather than relying on a single indicator reading.
⚠️ Important Compliance Note
This is a multi-condition analytical system, and each component functions as a separate filter layer. The indicator does not guarantee outcomes or predict price direction; instead, it organizes market data into structured conditions to help identify moments where multiple factors align within a defined framework.
🧾 Final Notes (House Rules Safe)
Alishba 02 – RSI Elite Toolkit is a structured, multi-layer analytical framework designed to interpret market momentum through a combination of RSI behavior, trend structure, and higher timeframe context. The system is built on the principle that no single indicator condition should be treated in isolation, and that more meaningful signals emerge only when multiple independent factors align together.
This toolkit uses RSI transitions as the primary event trigger, focusing on movement out of overbought and oversold zones rather than fixed threshold interpretations. These transitions are then evaluated through additional layers such as trend structure, higher timeframe alignment, momentum strength, and extreme zone behavior to build a more complete view of market conditions.
Each component in the system serves a specific purpose: the trend filter provides directional context, the higher timeframe RSI adds broader market perspective, velocity measures momentum intensity, and depth analysis evaluates exhaustion conditions. A cooldown mechanism is also included to maintain clarity by preventing excessive signal repetition during low-volatility or sideways market phases.
Overall, this indicator is intended as a decision-support and market analysis tool rather than a predictive system. It helps organize price behavior into structured conditions where multiple factors are evaluated together to improve clarity in interpreting market momentum and potential shifts in behavior.
Trading decisions should always be made using proper risk management and additional analysis tools alongside this system, as no indicator can guarantee future market outcomes.
⚠️ Disclaimer (House Rules Safe)
Alishba 02 – RSI Elite Toolkit is a technical analysis tool designed to assist in studying market momentum, trend structure, and higher timeframe conditions. It is intended for informational and educational use only and should not be considered financial advice, investment advice, or a guarantee of trading results.
All signals generated by this indicator are based on historical price data and calculated conditions such as RSI behavior, trend alignment, and momentum filters. These signals represent potential areas of interest in market structure analysis but do not predict future price movements or ensure any specific outcome.
Users should be aware that financial markets involve risk and can result in losses. This tool should be used as part of a broader analysis process that includes proper risk management, independent judgment, and additional confirmation methods.
Past performance or signal behavior observed using this indicator does not guarantee similar results in the future. All trading decisions remain the sole responsibility of the user.
開源腳本
秉持TradingView一貫精神,這個腳本的創作者將其設為開源,以便交易者檢視並驗證其功能。向作者致敬!您可以免費使用此腳本,但請注意,重新發佈代碼需遵守我們的社群規範。

免責聲明
這些資訊和出版物並非旨在提供,也不構成TradingView提供或認可的任何形式的財務、投資、交易或其他類型的建議或推薦。請閱讀使用條款以了解更多資訊。
開源腳本
秉持TradingView一貫精神,這個腳本的創作者將其設為開源,以便交易者檢視並驗證其功能。向作者致敬!您可以免費使用此腳本,但請注意,重新發佈代碼需遵守我們的社群規範。
免責聲明
這些資訊和出版物並非旨在提供,也不構成TradingView提供或認可的任何形式的財務、投資、交易或其他類型的建議或推薦。請閱讀使用條款以了解更多資訊。