Liquidation vs Stop: Leverage Check
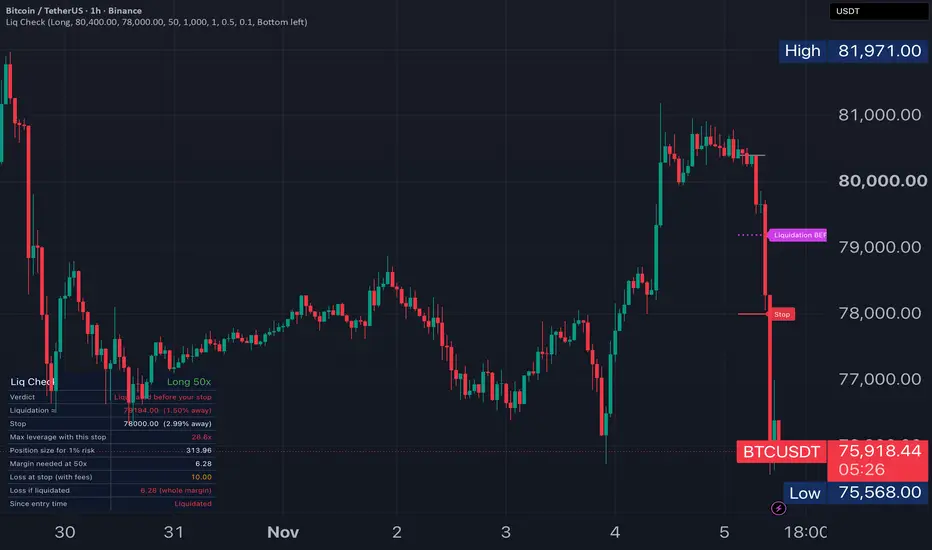
Liq Check shows where a leveraged trade would be liquidated, and whether your stop loss is reached first. If liquidation sits between your entry and your stop, the stop never gets a chance: the position is closed on the way and the whole margin is gone, instead of the loss you planned.
HOW TO USE
- Add the script to the chart of the coin you're trading.
- TradingView asks you to click three things: the entry candle, then the entry price and the stop loss price.
- Open the settings to set the side (Long or Short), leverage, account balance, risk per trade, maintenance margin and fee.
- Lines mark the entry, the stop and the estimated liquidation price. The table shows the verdict and the numbers.
WHAT THE TABLE SHOWS
- Verdict: "Stop comes first" or "Liquidated before your stop"
- Liquidation price (estimate) and how far it is from the entry
- Stop price and its distance
- Max leverage with this stop: the highest leverage that keeps liquidation beyond your stop
- Position size for your risk %: the size where a stop-out costs about that % of the balance, fees included
- Margin needed at your leverage, with a warning if it's more than the balance
- Loss at the stop, and the loss if liquidated (the whole margin)
- Since entry time: whether the stop or the liquidation level has been touched on this chart since the entry candle
HOW IT COUNTS
- Liquidation estimate for an isolated-margin position: long ≈ entry × (1 − 1/leverage + maintenance margin), short ≈ entry × (1 + 1/leverage − maintenance margin).
- Max leverage with the stop = 1 ÷ (stop distance + maintenance margin).
- Position size = (balance × risk %) ÷ (stop distance + fee on entry + fee on exit).
- Leverage doesn't change the loss at the stop when you size by the stop. It changes how much margin you lock up and how close liquidation sits.
EXAMPLE ON THIS CHART
BTCUSDT 1h, long from 80,400 with the stop at 78,000 (2.99% away) at 50x. Liquidation is about 79,194, only 1.5% away, so the position is closed long before the stop. With this stop, anything above 28.6x has the same problem.
LIMITATIONS
- It's an estimate. Exchanges use tiered maintenance margin, and funding and fees can move the real liquidation price. Always check the price your exchange shows.
- Cross margin works differently: liquidation depends on the whole balance, so this estimate doesn't apply.
- "Since entry time" uses the candles on your chart and the exchange feed you picked.
This is an educational risk tool. It is not financial advice and does not generate signals.
HOW TO USE
- Add the script to the chart of the coin you're trading.
- TradingView asks you to click three things: the entry candle, then the entry price and the stop loss price.
- Open the settings to set the side (Long or Short), leverage, account balance, risk per trade, maintenance margin and fee.
- Lines mark the entry, the stop and the estimated liquidation price. The table shows the verdict and the numbers.
WHAT THE TABLE SHOWS
- Verdict: "Stop comes first" or "Liquidated before your stop"
- Liquidation price (estimate) and how far it is from the entry
- Stop price and its distance
- Max leverage with this stop: the highest leverage that keeps liquidation beyond your stop
- Position size for your risk %: the size where a stop-out costs about that % of the balance, fees included
- Margin needed at your leverage, with a warning if it's more than the balance
- Loss at the stop, and the loss if liquidated (the whole margin)
- Since entry time: whether the stop or the liquidation level has been touched on this chart since the entry candle
HOW IT COUNTS
- Liquidation estimate for an isolated-margin position: long ≈ entry × (1 − 1/leverage + maintenance margin), short ≈ entry × (1 + 1/leverage − maintenance margin).
- Max leverage with the stop = 1 ÷ (stop distance + maintenance margin).
- Position size = (balance × risk %) ÷ (stop distance + fee on entry + fee on exit).
- Leverage doesn't change the loss at the stop when you size by the stop. It changes how much margin you lock up and how close liquidation sits.
EXAMPLE ON THIS CHART
BTCUSDT 1h, long from 80,400 with the stop at 78,000 (2.99% away) at 50x. Liquidation is about 79,194, only 1.5% away, so the position is closed long before the stop. With this stop, anything above 28.6x has the same problem.
LIMITATIONS
- It's an estimate. Exchanges use tiered maintenance margin, and funding and fees can move the real liquidation price. Always check the price your exchange shows.
- Cross margin works differently: liquidation depends on the whole balance, so this estimate doesn't apply.
- "Since entry time" uses the candles on your chart and the exchange feed you picked.
This is an educational risk tool. It is not financial advice and does not generate signals.

免責聲明
這些資訊和出版物並非旨在提供,也不構成TradingView提供或認可的任何形式的財務、投資、交易或其他類型的建議或推薦。請閱讀使用條款以了解更多資訊。
免責聲明
這些資訊和出版物並非旨在提供,也不構成TradingView提供或認可的任何形式的財務、投資、交易或其他類型的建議或推薦。請閱讀使用條款以了解更多資訊。