OPEN-SOURCE SCRIPT
已更新 Quantum Main Chart Divergence v1
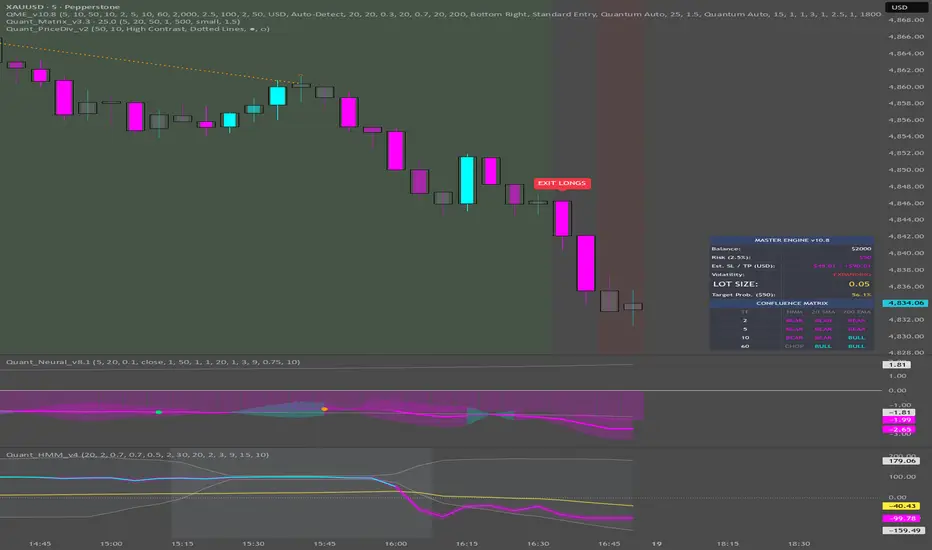
Quantum Main Chart Divergence - The Confluence Scanner
Overview Looking back and forth between price action and multiple sub-chart oscillators can cause trader fatigue and delayed entries. The Quantum Main Chart Divergence acts as a heads-up display (HUD), bringing complex sub-chart analysis directly onto your candlesticks. This indicator runs a hidden, "under-the-hood" Adaptive Z-Score engine to scan for structural momentum shifts, printing clean, unobtrusive divergence labels exactly where the price pivots occur.
Key Highlights
• Invisible Adaptive Engine: It calculates an Efficiency Ratio-driven Adaptive Z-Score entirely in the background. You get the power of an advanced institutional oscillator without cluttering your screen with another pane.
• Instant Visual Confirmation: Prints crisp "R" (Regular) and "H" (Hidden) labels directly above or below the trigger candles the moment a structural pivot is confirmed.
• Plug-and-Play Themes: Features a built-in theme selector (Dark, Light, and High Contrast) so the divergence labels automatically match your chart's aesthetic without needing to manually tweak individual color hex codes.
• Failsafe Mathematics: Built with a mathematical safeguard to ensure the hidden oscillator remains stable and never throws division-by-zero errors during extremely low-volatility, flatline market conditions.
How to Trade It
1. Regular Divergence ("R"): Indicates exhaustion. If price makes a lower low but the hidden oscillator makes a higher low, a Bullish "R" label prints. Use this to anticipate major reversals, catch falling knives safely, or exit existing trend trades.
2. Hidden Divergence ("H"): Indicates trend continuation. If price makes a higher low but the oscillator dips to a lower low, a Bullish "H" label prints. This flags the exact moment a pullback has finished and the primary trend is ready to resume.
The Quantum Ecosystem Integration
This indicator serves as the ultimate "Trigger Confirmation" for the Quantum Trading System.
• Quantum Adaptive Session Profile (SVP): When price approaches your Adaptive POC, VAH, or VAL, wait for an "R" or "H" label to print. A divergence precisely at a structural level is a top-tier setup.
• Quantum Confluence [Trendilo + BSP]: If you see a Bullish "R" on the main chart, look down at your Trendilo sub-chart. If Trendilo is glowing Neon Cyan and your BSP histogram is showing strong buying pressure, you have ultimate confluence. Execute the trade.
⚠️ DISCLAIMER: STRICTLY FOR EDUCATIONAL PURPOSES The information, scripts, and concepts provided in this publication are for educational and informational purposes only and do not constitute financial, investment, or trading advice. Trading in financial markets (including Forex, Crypto, Stocks, and Commodities) carries a high level of risk and may not be suitable for all investors. You could lose some or all of your initial investment. Past performance is not indicative of future results. Always conduct your own due diligence, backtest any strategy thoroughly, and consult with a certified financial advisor before making any trading decisions. By using this script, you acknowledge that you are solely responsible for your own trading actions and outcomes.
Overview Looking back and forth between price action and multiple sub-chart oscillators can cause trader fatigue and delayed entries. The Quantum Main Chart Divergence acts as a heads-up display (HUD), bringing complex sub-chart analysis directly onto your candlesticks. This indicator runs a hidden, "under-the-hood" Adaptive Z-Score engine to scan for structural momentum shifts, printing clean, unobtrusive divergence labels exactly where the price pivots occur.
Key Highlights
• Invisible Adaptive Engine: It calculates an Efficiency Ratio-driven Adaptive Z-Score entirely in the background. You get the power of an advanced institutional oscillator without cluttering your screen with another pane.
• Instant Visual Confirmation: Prints crisp "R" (Regular) and "H" (Hidden) labels directly above or below the trigger candles the moment a structural pivot is confirmed.
• Plug-and-Play Themes: Features a built-in theme selector (Dark, Light, and High Contrast) so the divergence labels automatically match your chart's aesthetic without needing to manually tweak individual color hex codes.
• Failsafe Mathematics: Built with a mathematical safeguard to ensure the hidden oscillator remains stable and never throws division-by-zero errors during extremely low-volatility, flatline market conditions.
How to Trade It
1. Regular Divergence ("R"): Indicates exhaustion. If price makes a lower low but the hidden oscillator makes a higher low, a Bullish "R" label prints. Use this to anticipate major reversals, catch falling knives safely, or exit existing trend trades.
2. Hidden Divergence ("H"): Indicates trend continuation. If price makes a higher low but the oscillator dips to a lower low, a Bullish "H" label prints. This flags the exact moment a pullback has finished and the primary trend is ready to resume.
The Quantum Ecosystem Integration
This indicator serves as the ultimate "Trigger Confirmation" for the Quantum Trading System.
• Quantum Adaptive Session Profile (SVP): When price approaches your Adaptive POC, VAH, or VAL, wait for an "R" or "H" label to print. A divergence precisely at a structural level is a top-tier setup.
• Quantum Confluence [Trendilo + BSP]: If you see a Bullish "R" on the main chart, look down at your Trendilo sub-chart. If Trendilo is glowing Neon Cyan and your BSP histogram is showing strong buying pressure, you have ultimate confluence. Execute the trade.
⚠️ DISCLAIMER: STRICTLY FOR EDUCATIONAL PURPOSES The information, scripts, and concepts provided in this publication are for educational and informational purposes only and do not constitute financial, investment, or trading advice. Trading in financial markets (including Forex, Crypto, Stocks, and Commodities) carries a high level of risk and may not be suitable for all investors. You could lose some or all of your initial investment. Past performance is not indicative of future results. Always conduct your own due diligence, backtest any strategy thoroughly, and consult with a certified financial advisor before making any trading decisions. By using this script, you acknowledge that you are solely responsible for your own trading actions and outcomes.
發行說明
📢 Release Notes: Quantum Main Chart Divergence v2 [Zero-Lag]Overview:
The Main Chart Divergence engine has officially been brought up to the v10.8 architectural standard. We have stripped out the legacy, lagging Z-score mechanics and completely replaced them with our proprietary "Ghost Core" engine to ensure absolute mathematical synergy with the Quantum Adaptive SVP matrix.
🔥 Major Upgrades in v2:
- Zero-Lag "Ghost Core" Integration: The indicator is now powered by the same Trendilo-based Adaptive Moving Average (driven by an Efficiency Ratio volatility filter) as our core volume matrix. Your price divergences are now reading the exact same hidden kinetic forces as your volume profile.
- Hyper-Fast Pivot Confirmation: We removed legacy pivot-lookback functions (ta.pivothigh/low) which inherently cause signal lag. v2 utilizes an instant 1-bar swing confirmation algorithm, allowing the divergence signals to fire exactly when the extreme is locked in, giving you maximum entry advantage.
- 4-State Visual Architecture: Fully overhauled the thematic rendering. The engine now beautifully distinguishes between Regular and Hidden divergences across both Bullish and Bearish axes, cleanly mapped to your UI Theme selector (High Contrast, Dark, or Light).
Trader's Note:
If you are running the Quantum SVP & Mitigation Zones alongside this indicator, you will now see total harmonic alignment between your volume anomalies and your price divergences. Trust the Ghost Core, and execute the structural bounces!
開源腳本
秉持TradingView一貫精神,這個腳本的創作者將其設為開源,以便交易者檢視並驗證其功能。向作者致敬!您可以免費使用此腳本,但請注意,重新發佈代碼需遵守我們的社群規範。

免責聲明
這些資訊和出版物並非旨在提供,也不構成TradingView提供或認可的任何形式的財務、投資、交易或其他類型的建議或推薦。請閱讀使用條款以了解更多資訊。
開源腳本
秉持TradingView一貫精神,這個腳本的創作者將其設為開源,以便交易者檢視並驗證其功能。向作者致敬!您可以免費使用此腳本,但請注意,重新發佈代碼需遵守我們的社群規範。
免責聲明
這些資訊和出版物並非旨在提供,也不構成TradingView提供或認可的任何形式的財務、投資、交易或其他類型的建議或推薦。請閱讀使用條款以了解更多資訊。