OPEN-SOURCE SCRIPT
Velorum Deviation Corridor [JOAT]
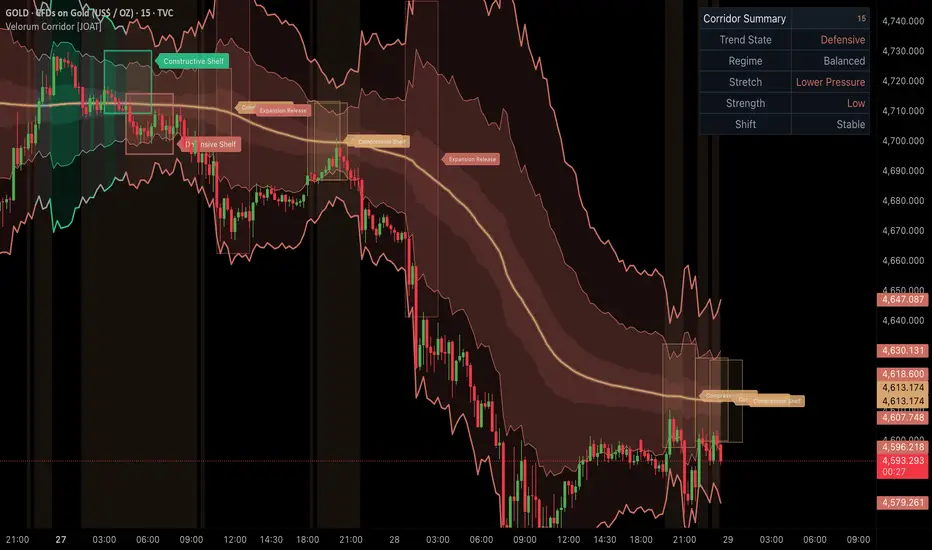
Velorum Deviation Corridor [JOAT]
Introduction
Velorum Deviation Corridor is an open-source adaptive price envelope designed to measure directional bias, stretch, and compression around a dynamic baseline. The script does not treat all volatility the same. It allows different baseline engines and different width engines, then converts that information into an overlay corridor that can show trend continuation, overextension, and volatility contraction in one place.
The problem this script solves is that static envelopes often fail when market speed changes. A fixed moving average with a fixed-width band may lag badly during acceleration and overreact during compression. Velorum addresses that by pairing adaptive baseline logic with multiple volatility models, then confirming state shifts only after bars close. The result is a directional overlay that can function as a trend frame, pullback map, and stretch monitor.

Core Concepts
1. Adaptive Baseline Selection
The script allows the user to choose among several baseline models: EMA, Hull, Adaptive KAMA, VIDYA, FRAMA, and Gaussian smoothing. This makes the corridor usable across different styles. Faster baselines react more quickly to rotation. More adaptive baselines try to react quickly in clean trends and slow down in noisy environments.
2. Multi-Model Width Estimation
The width engine can use ATR, standard deviation, Parkinson volatility, efficiency range, or a hybrid model. This matters because volatility can be defined in different ways. ATR captures absolute travel, standard deviation captures dispersion, Parkinson emphasizes high-low structure, and the hybrid approach blends multiple aspects into one corridor width.
Pine Script®
3. Compression and Expansion Detection
The script tracks corridor width over a rolling lookback and compares it against a compression percentile. When width contracts into the lower part of its recent range, the script identifies a compression state. When width expands with directional slope and position agreement, the script identifies expansion. This helps distinguish quiet consolidation from meaningful travel.
4. Trend State and Stretch Logic
Trend state is determined by baseline slope, price position relative to the corridor, and confirmation bars. The script also measures stretch so users can see whether price is trading inside the value area of the corridor, near the edge, or outside it. That makes it useful for both continuation logic and reversion-aware caution.
5. Transition Ribbon, Reaction Shelves, and Drift Lanes
The overlay uses outer bands, inner bands, corridor fills, glow layers, and a narrow transition ribbon around the baseline. It also projects on-chart structure when important corridor events occur. Confirmed constructive and defensive shifts can create forward shelf boxes. Confirmed excursions outside the corridor can create upper and lower drift lanes. Compression and expansion transitions can also stamp temporary forward boxes directly on the chart, turning the corridor into a working structure map instead of only a band set.
Features
Input Parameters
Core Engine:
Trend State:
Width Model:
How to Use This Indicator
Step 1: Identify the Baseline Bias
Start with price relative to the baseline and the dashboard's Trend State row. If price is holding above a rising baseline, the corridor is acting as bullish structure. If price is holding below a falling baseline, the corridor is acting as bearish structure.
Step 2: Check Compression Before Breakouts
Compression phases are useful because directional expansions often begin after width contracts. If the chart is tinted for compression and width percentile is low, watch for a confirmed shift rather than treating every small move as a new trend.
Step 3: Use Inner vs Outer Bands Differently
The inner bands are the working area for pullbacks and value. The outer bands represent more extended travel. When price repeatedly walks an outer band, that is continuation behavior. When price snaps outside and immediately loses follow-through, that is often stretch rather than sustainable expansion.
Step 4: Use Reaction Shelves and Drift Lanes as Forward Reference
When a confirmed constructive or defensive shift occurs, Velorum can project a forward shelf box. When price closes beyond the outer corridor, it can print a drift lane. These structures are intended to mark the part of the chart where continuation behavior should stay organized. If price immediately loses those zones, the move is weakening.
Step 5: Treat Confirmed Shift as the State Change
The confirmed shift output is still the important regime event. Intrabar movement can test both sides of the corridor, but the script only promotes a new state after bar confirmation and only stamps new corridor structures after confirmation.
Indicator Limitations
Originality Statement
Velorum Deviation Corridor is original in the way it separates the baseline problem from the width problem and lets those two adaptive layers interact in one confirmed-state overlay. The script is not simply a renamed moving average envelope. It combines multiple smoothing families, multiple volatility families, width percentile compression logic, stretch-state interpretation, transition-ribbon state framing, and event-driven forward shelf and lane boxes into one cohesive corridor framework.
Disclaimer
This script is provided for educational and informational purposes only. It is not financial advice. Corridor behavior is based on historical price action and can lag, compress, or expand unpredictably during unusual market conditions. Always evaluate signals in context and use appropriate risk controls.
Introduction
Velorum Deviation Corridor is an open-source adaptive price envelope designed to measure directional bias, stretch, and compression around a dynamic baseline. The script does not treat all volatility the same. It allows different baseline engines and different width engines, then converts that information into an overlay corridor that can show trend continuation, overextension, and volatility contraction in one place.
The problem this script solves is that static envelopes often fail when market speed changes. A fixed moving average with a fixed-width band may lag badly during acceleration and overreact during compression. Velorum addresses that by pairing adaptive baseline logic with multiple volatility models, then confirming state shifts only after bars close. The result is a directional overlay that can function as a trend frame, pullback map, and stretch monitor.
Core Concepts
1. Adaptive Baseline Selection
The script allows the user to choose among several baseline models: EMA, Hull, Adaptive KAMA, VIDYA, FRAMA, and Gaussian smoothing. This makes the corridor usable across different styles. Faster baselines react more quickly to rotation. More adaptive baselines try to react quickly in clean trends and slow down in noisy environments.
2. Multi-Model Width Estimation
The width engine can use ATR, standard deviation, Parkinson volatility, efficiency range, or a hybrid model. This matters because volatility can be defined in different ways. ATR captures absolute travel, standard deviation captures dispersion, Parkinson emphasizes high-low structure, and the hybrid approach blends multiple aspects into one corridor width.
3. Compression and Expansion Detection
The script tracks corridor width over a rolling lookback and compares it against a compression percentile. When width contracts into the lower part of its recent range, the script identifies a compression state. When width expands with directional slope and position agreement, the script identifies expansion. This helps distinguish quiet consolidation from meaningful travel.
4. Trend State and Stretch Logic
Trend state is determined by baseline slope, price position relative to the corridor, and confirmation bars. The script also measures stretch so users can see whether price is trading inside the value area of the corridor, near the edge, or outside it. That makes it useful for both continuation logic and reversion-aware caution.
5. Transition Ribbon, Reaction Shelves, and Drift Lanes
The overlay uses outer bands, inner bands, corridor fills, glow layers, and a narrow transition ribbon around the baseline. It also projects on-chart structure when important corridor events occur. Confirmed constructive and defensive shifts can create forward shelf boxes. Confirmed excursions outside the corridor can create upper and lower drift lanes. Compression and expansion transitions can also stamp temporary forward boxes directly on the chart, turning the corridor into a working structure map instead of only a band set.
Features
- Six baseline models: EMA, Hull, Adaptive KAMA, VIDYA, FRAMA, and Gaussian
- Five width engines: ATR, standard deviation, Parkinson, efficiency range, and hybrid volatility
- Compression detection: Width percentile model highlights contraction phases
- Trend confirmation bars: Direction changes require confirmation before they are treated as valid
- Stretch context: Shows whether price is centered, extended, or outside the corridor
- Layered overlay: Baseline, glow, inner bands, outer bands, fills, and transition ribbon
- Reaction shelves: Confirmed constructive and defensive shifts can project forward box zones on the chart
- Drift lanes: Confirmed closes outside the corridor can stamp directional lane boxes
- Compression shelf and expansion release: Corridor state transitions can create temporary forward structure boxes
- On-chart labels: Shelf, lane, and release labels appear directly on the price chart
- Compact dashboard summary: Trend state, regime, stretch, strength, and confirmed shift in a smaller top-right panel
- Confirmed-bar alerts: Lift, fade, compression, and expansion events
Input Parameters
Core Engine:
- Source
- Baseline Model
- Baseline Length
- Fast and Slow Components for adaptive models
Trend State:
- Trend Confirmation Bars
- Slope Lookback
- Trend Strength Length
- Compression Lookback
- Compression Percentile
Width Model:
- Width Model
- Width Length
- Width Multiplier
- Elasticity Factor
How to Use This Indicator
Step 1: Identify the Baseline Bias
Start with price relative to the baseline and the dashboard's Trend State row. If price is holding above a rising baseline, the corridor is acting as bullish structure. If price is holding below a falling baseline, the corridor is acting as bearish structure.
Step 2: Check Compression Before Breakouts
Compression phases are useful because directional expansions often begin after width contracts. If the chart is tinted for compression and width percentile is low, watch for a confirmed shift rather than treating every small move as a new trend.
Step 3: Use Inner vs Outer Bands Differently
The inner bands are the working area for pullbacks and value. The outer bands represent more extended travel. When price repeatedly walks an outer band, that is continuation behavior. When price snaps outside and immediately loses follow-through, that is often stretch rather than sustainable expansion.
Step 4: Use Reaction Shelves and Drift Lanes as Forward Reference
When a confirmed constructive or defensive shift occurs, Velorum can project a forward shelf box. When price closes beyond the outer corridor, it can print a drift lane. These structures are intended to mark the part of the chart where continuation behavior should stay organized. If price immediately loses those zones, the move is weakening.
Step 5: Treat Confirmed Shift as the State Change
The confirmed shift output is still the important regime event. Intrabar movement can test both sides of the corridor, but the script only promotes a new state after bar confirmation and only stamps new corridor structures after confirmation.
Indicator Limitations
- No single baseline model is best for every market; users may need to select a model appropriate for their instrument and timeframe
- Compression does not guarantee breakout direction, only reduced width
- A fast corridor can overreact in noisy markets while a slow corridor can lag during sharp reversals
- Stretch beyond the outer band can persist longer than expected in strong trends
- Reaction shelves and drift lanes are contextual structure tools, not guaranteed support or resistance
Originality Statement
Velorum Deviation Corridor is original in the way it separates the baseline problem from the width problem and lets those two adaptive layers interact in one confirmed-state overlay. The script is not simply a renamed moving average envelope. It combines multiple smoothing families, multiple volatility families, width percentile compression logic, stretch-state interpretation, transition-ribbon state framing, and event-driven forward shelf and lane boxes into one cohesive corridor framework.
Disclaimer
This script is provided for educational and informational purposes only. It is not financial advice. Corridor behavior is based on historical price action and can lag, compress, or expand unpredictably during unusual market conditions. Always evaluate signals in context and use appropriate risk controls.
開源腳本
秉持TradingView一貫精神,這個腳本的創作者將其設為開源,以便交易者檢視並驗證其功能。向作者致敬!您可以免費使用此腳本,但請注意,重新發佈代碼需遵守我們的社群規範。

The Institutional Grade Trading Ecosystem, Built to win trades 📈
Get Access 👇
jackofalltrades.vip 🌐
t.me/jackofalltradesvip 🃏
Get Access 👇
jackofalltrades.vip 🌐
t.me/jackofalltradesvip 🃏
免責聲明
這些資訊和出版物並非旨在提供,也不構成TradingView提供或認可的任何形式的財務、投資、交易或其他類型的建議或推薦。請閱讀使用條款以了解更多資訊。
開源腳本
秉持TradingView一貫精神,這個腳本的創作者將其設為開源,以便交易者檢視並驗證其功能。向作者致敬!您可以免費使用此腳本,但請注意,重新發佈代碼需遵守我們的社群規範。
The Institutional Grade Trading Ecosystem, Built to win trades 📈
Get Access 👇
jackofalltrades.vip 🌐
t.me/jackofalltradesvip 🃏
Get Access 👇
jackofalltrades.vip 🌐
t.me/jackofalltradesvip 🃏
免責聲明
這些資訊和出版物並非旨在提供,也不構成TradingView提供或認可的任何形式的財務、投資、交易或其他類型的建議或推薦。請閱讀使用條款以了解更多資訊。