已更新
ATR Drift %
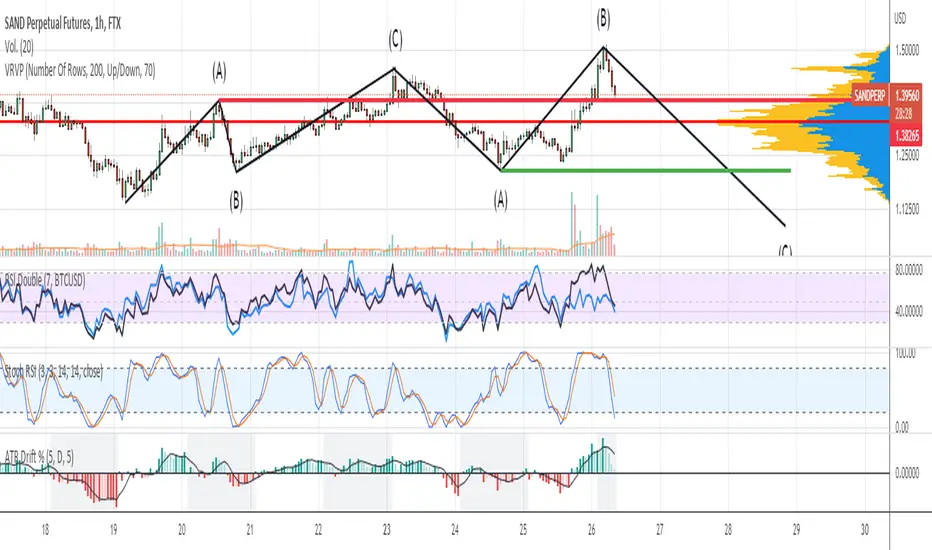
This script plots an histogram calculated this way:
Get the previous ATR sample, calculated in the specified timeframe
Get the actual open price of the bar in the specified timeframe minus the actual price in the current timeframe
and plots the percent change between the the 2 values
For example, if you select DAY as timeframe for the ATR:
Plots the percent change between:
- ATR(daily) from yesterday
and
- open from today - actual price
Due to Tradingview limitations, only shows the plot if the actual timeframe of the graphic is equal or lower that the ATR selected timeframe
The background changes shows a new ATR sample taking place
I'm testing this for scalping in 5M timeframe with the ATR in 4H
All my published scripts at: es.tradingview.com/u/Nakitxu/
發行說明
Changed the background change logic發行說明
Added SMA smooth
Hodl!
免責聲明
這些資訊和出版物並非旨在提供,也不構成TradingView提供或認可的任何形式的財務、投資、交易或其他類型的建議或推薦。請閱讀使用條款以了解更多資訊。