OPEN-SOURCE SCRIPT
已更新 Multi-Factor Divergence Matrix
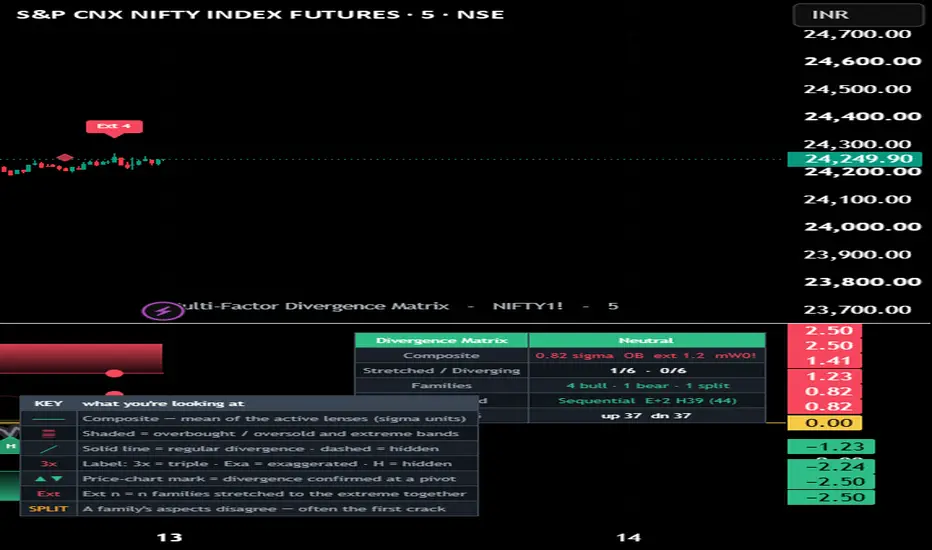
Multi-Factor Divergence Matrix
OVERVIEW
Most divergence tools read one oscillator against price. The Multi-Factor Divergence Matrix reads fifteen independent lenses at once, standardizes them onto a single shared standard-deviation (sigma) scale, and then organizes them into a structure: lenses roll up into 14 aspects (distinct questions), aspects roll up into 6 families (factor classes), and families roll up into one composite. Divergence is detected five different ways on that construction, and a built-in calibration harness scores whether each method has actually carried any edge on your instrument.
The core idea: a price move is more trustworthy when many independent reads confirm it, and a divergence is more meaningful when it shows up across different kinds of information — not just three flavours of momentum that all say the same thing.
WHY THE COMPONENTS BELONG IN ONE SCRIPT (mashup rationale)
This is a deliberate multi-factor engine, not indicators stacked side by side. Every part answers the same question — is this price move confirmed, and by how broad a set of independent reads? — and each fixes a blind spot of the others:
A single oscillator can only diverge one way. Fifteen lenses across six families let price be unconfirmed by momentum, by trend efficiency, by location, by volatility, by order flow, or by cross-asset carry — independently.
Raw factor-stacking double-counts. Standardizing every lens to one sigma scale makes them directly comparable, and grouping correlated lenses into aspects (then families) means consensus is counted where it carries independent information, not where it merely repeats.
One detection method misses what another catches. Pivot divergence is precise but lags; slope fires earlier; correlation is continuous; sequential catches structured exhaustion; the intra-family split is often the very first crack. Run together, they cover the ways divergence actually appears.
Assertions are cheap. The calibration harness ties the whole construction back to realized forward outcomes, per method, so the tool reports whether its own signals carry edge rather than claiming they do.
Remove any one layer and the central question is answered less completely — which is what makes them one tool.
HOW IT WORKS
The 15 lenses → 14 aspects → 6 families
Momentum — oscillatory (RSI + Know Sure Thing), velocity (low-lag two-pole strength), stationary (fractional-difference of log price)
Trend / Efficiency — path quality (Kaufman efficiency ratio), extension (SAR distance in ATR units), rollover (dual-horizon efficiency gap)
Location / Mean — volume-anchored (VWAP deviation), geometric (linear-regression deviation)
Volatility — realized expansion (directional range), implied-vs-realized (variance-risk-premium spread)
Flow / Volume — net pressure (cumulative signed-volume delta, lower-timeframe estimated), volume-weighted (Money Flow Index)
Cross-Asset — carry (futures-vs-spot basis), fear (volatility-index vs price)
Each lens is z-scored over a rolling window (up = bullish). Correlated lenses that answer the same question (e.g. RSI and KST) are averaged into one aspect — the anti-redundancy step. A family agrees only when a majority of its filled aspects align; when its aspects disagree it is flagged SPLIT.
Two consensus axes, both at family resolution, auto-scaled by timeframe
Extreme-count — how many families are stretched to their extreme.
Divergence-count — how many families are diverging from price right now.
Five detection methods
Pivot — regular, hidden, exaggerated (equal-extreme) and triple divergence on the composite.
Slope — price-vs-composite regression-slope sign disagreement (fires earlier than pivots).
Correlation — rolling price-composite correlation flipping negative (continuous, always-on).
Sequential — a structured RSI exhaustion pattern (three deeper pushes, then a turn).
Leading — the intra-family SPLIT, often the first warning before a family flips.
Calibration. Each event is a directional hypothesis, queued and resolved a fixed horizon later versus an ATR threshold, then compared with the unconditional same-horizon base rate. The dashboard reports, per method: number of events, Hit %, and Edge = Hit − Base. Events are logged and resolved on confirmed bars only.
HOW TO USE
The dashboard has two modes. Compact (default) shows the decision essentials: the composite zone, the two consensus counts (Stretched X/6 · Diverging Y/6), a one-line family summary (bull / bear / split), and the single best-calibrated method with its Edge. Pro expands this to every family row (vote arrow, aspect agreement, SPLIT flag) and every per-method calibration class. In both, a high divergence-count backed by clean family agreement is strong context; the Edge figure tells you whether that read has actually preceded a move on this symbol and timeframe. Treat consensus as context, never a standalone trigger.
UNIVERSAL ACROSS MARKETS
Price, high, low, the VWAP source, the spot reference symbol and the volatility symbol are all inputs, so the engine runs on any instrument and timeframe. Volume-based lenses (VWAP, flow, MFI) need real traded volume — use the futures contract, not a cash index. Defaults target NSE NIFTY index futures intraday with an NSE:NIFTY spot reference and NSE:INDIAVIX; lenses without data quietly drop out and the consensus scales to whatever stays active.
ORIGINALITY
The individual techniques are public and credited below. The original work is the integration: standardizing fifteen heterogeneous reads onto one sigma axis, the aspect → family → composite roll-up that counts agreement only where it is independent, the dual extreme-and-divergence consensus, the surfacing of intra-family disagreement as a leading signal, and the forward base-rate calibration over every detection method. No third-party Pine code is reused.
CONCEPT CREDIT
RSI, Parabolic SAR, ATR, DMI — J. Welles Wilder. Know Sure Thing — Martin J. Pring. Efficiency Ratio — Perry J. Kaufman. Money Flow Index — Quong & Soudack. VWAP and cumulative volume delta — standard public market-microstructure concepts. Fractional differentiation — the long-memory / stationarity literature (Hosking 1981; adapted for finance by M. López de Prado). Two-pole low-pass smoothing — John F. Ehlers. The basis is explained by the cost-of-carry framework (N. Kaldor 1939; H. Working 1948–49). Variance risk premium — the implied-minus-realized literature. Linear regression and price/oscillator divergence are long-established public techniques. Not affiliated with, nor endorsed by, any third party.
HONESTY / LIMITATIONS
Consensus is context, not a trigger. Independence is managed, not perfect — lenses inside a family still share inputs, which is exactly why consensus counts families and aspects rather than raw lenses, and why a high count is never proof. The Edge figures are in-sample, close-to-close, with overlapping forward windows and no costs — descriptive context, not a verified backtest. An Edge near zero, negative, or unstable across timeframes is the harness honestly telling you the method has no reliable edge on that instrument; do not tune parameters until it turns green — that is curve-fitting. Divergence and reversals confirm a few bars after their pivot (inherent to honest pivot detection). Nothing here predicts price.
DISCLAIMER
Research and educational tool only. NOT financial advice and NO guarantee of profitability or accuracy. Indicators describe past behaviour; they do not predict the future. Trading carries risk of loss. Test out-of-sample and make your own decisions. The author accepts no liability for any use of this script.
OVERVIEW
Most divergence tools read one oscillator against price. The Multi-Factor Divergence Matrix reads fifteen independent lenses at once, standardizes them onto a single shared standard-deviation (sigma) scale, and then organizes them into a structure: lenses roll up into 14 aspects (distinct questions), aspects roll up into 6 families (factor classes), and families roll up into one composite. Divergence is detected five different ways on that construction, and a built-in calibration harness scores whether each method has actually carried any edge on your instrument.
The core idea: a price move is more trustworthy when many independent reads confirm it, and a divergence is more meaningful when it shows up across different kinds of information — not just three flavours of momentum that all say the same thing.
WHY THE COMPONENTS BELONG IN ONE SCRIPT (mashup rationale)
This is a deliberate multi-factor engine, not indicators stacked side by side. Every part answers the same question — is this price move confirmed, and by how broad a set of independent reads? — and each fixes a blind spot of the others:
A single oscillator can only diverge one way. Fifteen lenses across six families let price be unconfirmed by momentum, by trend efficiency, by location, by volatility, by order flow, or by cross-asset carry — independently.
Raw factor-stacking double-counts. Standardizing every lens to one sigma scale makes them directly comparable, and grouping correlated lenses into aspects (then families) means consensus is counted where it carries independent information, not where it merely repeats.
One detection method misses what another catches. Pivot divergence is precise but lags; slope fires earlier; correlation is continuous; sequential catches structured exhaustion; the intra-family split is often the very first crack. Run together, they cover the ways divergence actually appears.
Assertions are cheap. The calibration harness ties the whole construction back to realized forward outcomes, per method, so the tool reports whether its own signals carry edge rather than claiming they do.
Remove any one layer and the central question is answered less completely — which is what makes them one tool.
HOW IT WORKS
The 15 lenses → 14 aspects → 6 families
Momentum — oscillatory (RSI + Know Sure Thing), velocity (low-lag two-pole strength), stationary (fractional-difference of log price)
Trend / Efficiency — path quality (Kaufman efficiency ratio), extension (SAR distance in ATR units), rollover (dual-horizon efficiency gap)
Location / Mean — volume-anchored (VWAP deviation), geometric (linear-regression deviation)
Volatility — realized expansion (directional range), implied-vs-realized (variance-risk-premium spread)
Flow / Volume — net pressure (cumulative signed-volume delta, lower-timeframe estimated), volume-weighted (Money Flow Index)
Cross-Asset — carry (futures-vs-spot basis), fear (volatility-index vs price)
Each lens is z-scored over a rolling window (up = bullish). Correlated lenses that answer the same question (e.g. RSI and KST) are averaged into one aspect — the anti-redundancy step. A family agrees only when a majority of its filled aspects align; when its aspects disagree it is flagged SPLIT.
Two consensus axes, both at family resolution, auto-scaled by timeframe
Extreme-count — how many families are stretched to their extreme.
Divergence-count — how many families are diverging from price right now.
Five detection methods
Pivot — regular, hidden, exaggerated (equal-extreme) and triple divergence on the composite.
Slope — price-vs-composite regression-slope sign disagreement (fires earlier than pivots).
Correlation — rolling price-composite correlation flipping negative (continuous, always-on).
Sequential — a structured RSI exhaustion pattern (three deeper pushes, then a turn).
Leading — the intra-family SPLIT, often the first warning before a family flips.
Calibration. Each event is a directional hypothesis, queued and resolved a fixed horizon later versus an ATR threshold, then compared with the unconditional same-horizon base rate. The dashboard reports, per method: number of events, Hit %, and Edge = Hit − Base. Events are logged and resolved on confirmed bars only.
HOW TO USE
The dashboard has two modes. Compact (default) shows the decision essentials: the composite zone, the two consensus counts (Stretched X/6 · Diverging Y/6), a one-line family summary (bull / bear / split), and the single best-calibrated method with its Edge. Pro expands this to every family row (vote arrow, aspect agreement, SPLIT flag) and every per-method calibration class. In both, a high divergence-count backed by clean family agreement is strong context; the Edge figure tells you whether that read has actually preceded a move on this symbol and timeframe. Treat consensus as context, never a standalone trigger.
UNIVERSAL ACROSS MARKETS
Price, high, low, the VWAP source, the spot reference symbol and the volatility symbol are all inputs, so the engine runs on any instrument and timeframe. Volume-based lenses (VWAP, flow, MFI) need real traded volume — use the futures contract, not a cash index. Defaults target NSE NIFTY index futures intraday with an NSE:NIFTY spot reference and NSE:INDIAVIX; lenses without data quietly drop out and the consensus scales to whatever stays active.
ORIGINALITY
The individual techniques are public and credited below. The original work is the integration: standardizing fifteen heterogeneous reads onto one sigma axis, the aspect → family → composite roll-up that counts agreement only where it is independent, the dual extreme-and-divergence consensus, the surfacing of intra-family disagreement as a leading signal, and the forward base-rate calibration over every detection method. No third-party Pine code is reused.
CONCEPT CREDIT
RSI, Parabolic SAR, ATR, DMI — J. Welles Wilder. Know Sure Thing — Martin J. Pring. Efficiency Ratio — Perry J. Kaufman. Money Flow Index — Quong & Soudack. VWAP and cumulative volume delta — standard public market-microstructure concepts. Fractional differentiation — the long-memory / stationarity literature (Hosking 1981; adapted for finance by M. López de Prado). Two-pole low-pass smoothing — John F. Ehlers. The basis is explained by the cost-of-carry framework (N. Kaldor 1939; H. Working 1948–49). Variance risk premium — the implied-minus-realized literature. Linear regression and price/oscillator divergence are long-established public techniques. Not affiliated with, nor endorsed by, any third party.
HONESTY / LIMITATIONS
Consensus is context, not a trigger. Independence is managed, not perfect — lenses inside a family still share inputs, which is exactly why consensus counts families and aspects rather than raw lenses, and why a high count is never proof. The Edge figures are in-sample, close-to-close, with overlapping forward windows and no costs — descriptive context, not a verified backtest. An Edge near zero, negative, or unstable across timeframes is the harness honestly telling you the method has no reliable edge on that instrument; do not tune parameters until it turns green — that is curve-fitting. Divergence and reversals confirm a few bars after their pivot (inherent to honest pivot detection). Nothing here predicts price.
DISCLAIMER
Research and educational tool only. NOT financial advice and NO guarantee of profitability or accuracy. Indicators describe past behaviour; they do not predict the future. Trading carries risk of loss. Test out-of-sample and make your own decisions. The author accepts no liability for any use of this script.
發行說明
Multi-Factor Divergence MatrixWhat it is. A consensus oscillator that arbitrates many divergence and exhaustion lenses into a single standardized composite, with a per-class forward-test scoreboard.
What's new in this update
Meta-weighted composite. The composite is now scaled by the fraction of its component classes that actually clear their own forward-tested edge (after a multiple-testing correction). Classes that don't beat their base rate contribute little or nothing — so the headline read down-weights itself when the evidence is thin.
Overfitting tripwire. A flag appears when very few classes are statistically significant despite enough samples to judge — a direct, visible warning against reading signal into noise when many lenses are scored at once.
Multiple-testing correction on the per-class significance stars, appropriate to the number of classes being evaluated simultaneously.
How the parts work together (why these lenses are combined). Divergence on price, momentum, correlation, slope, sequence and breadth are correlated but not identical read-outs of the same exhaustion idea. Combining them into one standardized composite reduces single-lens noise, but only if the combination is disciplined — which is exactly what the meta-weighting and the multiple-testing correction provide. The composite is the signal; the scoreboard tells you which lenses are currently earning their place.
Reusable outputs. The meta-weighted composite, consensus direction, divergence counts and the overfitting flag are published to the Data Window with generic names for input.source() use in a higher-level dashboard.
Educational only — class independence is managed, not perfect, and calibration windows overlap. Not financial advice.
發行說明
v2.1 — correctness and legibility. No engine changes; readings are identical to v2.0.Fixed — historical divergence lines could disappear from the chart. Pivot-divergence detection was running on every tick, including on the live bar. ta.pivothigh uses the current bar as its right-hand confirmation bar, so it flickers while that bar is still forming — and the drawing helper was pushing a fresh line and label on each tick. Because those arrays cap at 40 and shift the oldest entry out, and because Pine does not roll back array contents between intrabar ticks, live-bar churn could silently evict genuine historical divergence lines. Detection and drawing are now gated to confirmed bars, so past divergences persist as intended.
Fixed — the fractional-difference weight array is now guarded against a duplicate first-bar push.
Hardened — every lookback input is now bounded, and max_bars_back is declared, so an extreme setting can no longer silently truncate a lens or fail at runtime.
Added — a legend / key panel. Fifteen lenses across six families is a lot to read cold; the key explains every line, zone, label and mark.
開源腳本
秉持TradingView一貫精神,這個腳本的創作者將其設為開源,以便交易者檢視並驗證其功能。向作者致敬!您可以免費使用此腳本,但請注意,重新發佈代碼需遵守我們的社群規範。

免責聲明
這些資訊和出版物並非旨在提供,也不構成TradingView提供或認可的任何形式的財務、投資、交易或其他類型的建議或推薦。請閱讀使用條款以了解更多資訊。
開源腳本
秉持TradingView一貫精神,這個腳本的創作者將其設為開源,以便交易者檢視並驗證其功能。向作者致敬!您可以免費使用此腳本,但請注意,重新發佈代碼需遵守我們的社群規範。
免責聲明
這些資訊和出版物並非旨在提供,也不構成TradingView提供或認可的任何形式的財務、投資、交易或其他類型的建議或推薦。請閱讀使用條款以了解更多資訊。