MA.Proj - @collinplancy
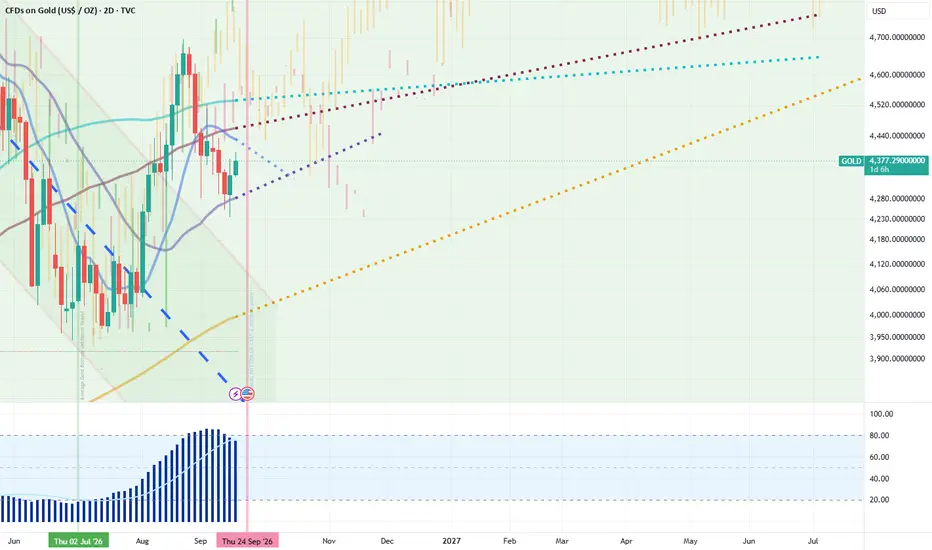
MA.Proj — Moving Average with Dynamic Forward Projections
Traditional moving averages stop dead at the current candle. MA.Proj extends your moving average forward into unformed chart space using momentum extrapolation, Heikin-Ashi directional vectors, and mathematical window roll-off modeling.
4 Projection Modes
Key Features
Pro Tip
Stack two instances on your chart (e.g., length 50 and 200, or 9 and 21). The projected dotted lines intersect in advance into empty chart space, giving you early visual notice of upcoming Golden or Death Crosses before the candles actually close.
Traditional moving averages stop dead at the current candle. MA.Proj extends your moving average forward into unformed chart space using momentum extrapolation, Heikin-Ashi directional vectors, and mathematical window roll-off modeling.
4 Projection Modes
- Linear Momentum (Straight Line) (Default) — Classical Dow Theory tangent-vector projection continuing the moving average's immediate slope.
- Damped Momentum (Exhaustion) — Applies an asymptotic decay curve to recent momentum. Decelerates incoming price while historical candles drop out of the sliding window, highlighting where the MA is mathematically likely to crest, flatten, or roll over.
- True Induction (Window Roll-off) — Pure mechanical sliding-window simulation. Shows the exact path the MA will take if price stalls at current levels, taking into account old extreme candles rolling out of the calculation.
- Heikin Ashi Induction — Uses the directional (haClose - haOpen) spread to project future momentum for sustained trend continuation.
Key Features
- Multi-Timeframe Engine (MTF) — Set any timeframe (defaults to 1D) with automatic timeframe dilation scaling.
- Configurable Horizons — Project forward 1/2x (default), 1x, 2x, 4x, or 16x the base MA length.
- Clean Status Line — Formats cleanly in your chart header as MA.Proj (Length, Timeframe) (e.g., MA.Proj (50, 1D)) without parameter clutter.
- Optimized Visuals — High-visibility 4px dotted projection paired with a 50% transparent base MA line to keep underlying price candles clear.
Pro Tip
Stack two instances on your chart (e.g., length 50 and 200, or 9 and 21). The projected dotted lines intersect in advance into empty chart space, giving you early visual notice of upcoming Golden or Death Crosses before the candles actually close.

免責聲明
這些資訊和出版物並非旨在提供,也不構成TradingView提供或認可的任何形式的財務、投資、交易或其他類型的建議或推薦。請閱讀使用條款以了解更多資訊。
免責聲明
這些資訊和出版物並非旨在提供,也不構成TradingView提供或認可的任何形式的財務、投資、交易或其他類型的建議或推薦。請閱讀使用條款以了解更多資訊。