Gravity Model overlay
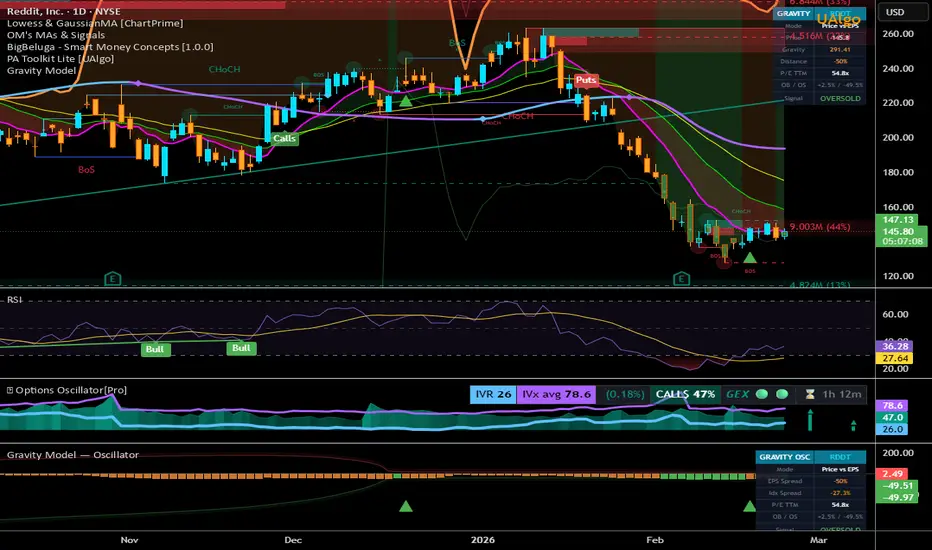
Gravity Model — Overlay
Indicator that projects a "gravity line" on chart — the fair value of price based on earnings growth rate (EPS TTM). Concept: if price perfectly tracked profit growth, it would sit on the gravity line. When it deviates significantly → mean reversion.
What it displays:
Gravity line (orange) — where price should be if it tracked earnings growth
OB/OS bands — dynamic bands based on mean ± 1.2σ of historical deviation
Fill color — cyan above gravity, orange below; intense red in OB, intense green in OS
Arrows — sell signal on OB exit, buy signal on OS exit
Info table — price, gravity, distance %, P/E, signal
3 modes: Price vs EPS, Price vs Index, Both.
Logic: gravity = price_N_bars_ago * (current_EPS / EPS_N_bars_ago), spread = % deviation from gravity. Earnings act as fundamental anchor, price oscillates around it like a pendulum.
Indicator that projects a "gravity line" on chart — the fair value of price based on earnings growth rate (EPS TTM). Concept: if price perfectly tracked profit growth, it would sit on the gravity line. When it deviates significantly → mean reversion.
What it displays:
Gravity line (orange) — where price should be if it tracked earnings growth
OB/OS bands — dynamic bands based on mean ± 1.2σ of historical deviation
Fill color — cyan above gravity, orange below; intense red in OB, intense green in OS
Arrows — sell signal on OB exit, buy signal on OS exit
Info table — price, gravity, distance %, P/E, signal
3 modes: Price vs EPS, Price vs Index, Both.
Logic: gravity = price_N_bars_ago * (current_EPS / EPS_N_bars_ago), spread = % deviation from gravity. Earnings act as fundamental anchor, price oscillates around it like a pendulum.

免責聲明
這些資訊和出版物並非旨在提供,也不構成TradingView提供或認可的任何形式的財務、投資、交易或其他類型的建議或推薦。請閱讀使用條款以了解更多資訊。