OPEN-SOURCE SCRIPT
已更新 SmartTraders Research Labs -Geometric Trend Lines - GTL
GEOMETRIC TREND LINES (GTL)
GTL is a research indicator that studies the geometry of price structures. It freezes structural anchors in the past, stretches two right-triangles between those anchors and the live candle, and reads their angles inside a dimensionless coordinate space — then learns from every completed structure to estimate, with calibrated statistics, which way the current one is leaning. It is a structural analysis and research tool, not a trading system.
█ STEP OUT OF THE CHART PLANE
Every trader has drawn a trendline and called it steep. Steep compared to what? Stretch the chart window and the angle flattens. Jump from Bitcoin to a quiet blue-chip stock and a "45-degree rally" becomes a completely different animal. The chart plane mixes two quantities that were never meant to share axes — price and time — so any angle drawn on it is a property of your zoom level, not of the market.
My standard, before any geometry begins, is to take the shape out of the chart plane entirely. GTL maps every point into an Isotropic Coordinate System (ICS) where both axes are pure numbers:
y = log(price) / σ
x = bars / lookback
Price is expressed in units of the instrument's own volatility (σ, estimated with the Yang-Zhang method over 500 bars), and time in units of the analysis window. Nothing on either axis carries dollars, lira, satoshis or minutes anymore.
In this space, a degree finally means something. The angle
θ = atan(Δy / Δx) × 180 / π
is intrinsic: a 60° ceiling angle on gold's 30-minute chart describes the same geometric event as a 60° ceiling angle on a 3-minute meme-coin chart. The instrument's personality — its price level, its tick size, its temperament — has been normalized away, and what remains is pure trajectory. Everything else in this indicator stands on that ground.

The same rally, two zoom levels, two different angles — and on the right, the dimensionless ICS home where θ finally becomes a property of the market, not of your screen.
█ THE TRIANGLE — A SHAPE THAT CARRIES DATA
Of all the shapes humanity has leaned on, the triangle is the one that never let us down. It raised the pyramids, it holds every bridge truss and roof frame you have ever walked under, and it is the only polygon that cannot be deformed without changing the length of a side. Engineers call that property rigidity. I read it as trustworthiness — a triangle does not lie about its geometry.
That is why I chose it as the measuring instrument. On every structure, GTL constructs two right-triangles inside ICS:
The ceiling triangle — from the frozen HH anchor to the live candle's high.
The floor triangle — from the frozen LL anchor to the live candle's low.
Each triangle is not a drawing; it is a container. Four measurements live inside it at every bar:
θ — the signed angle of the hypotenuse, the indicator's core reading
Δy — the signed magnitude of the move in volatility units
area — the geometric surface the structure has swept
centroid — the shape's center of mass in ICS
While price grinds below a frozen ceiling, the ceiling angle sinks degree by degree into negative territory. When price presses up from a frozen floor, the floor angle climbs. Two triangles breathe with the market — one watching from above, one from below — and their angles are the raw language everything downstream of this indicator speaks.

One triangle watches from above, one from below — and θ, Δy, area and centroid live inside each of them.
█ AN ANCHOR IN THE PAST — MEASURING FROM CALM WATER
Picture a storm at sea, and two people trying to measure the waves. One stands on the shore. One sits in a boat, right among them. The observer on the shore, feet on solid ground, reads the height of every wave with precision — however wild the water gets, the ground beneath him does not move. The observer in the boat rises and falls with the very thing he is trying to measure; every number he writes down is contaminated by his own motion.
Most swing-based tools are the observer in the boat. Their reference points — the latest swing high, the latest swing low — are redefined by the market again and again, so any angle or distance measured from them mixes two movements at once: the price's, and the reference's own.
GTL plants its observer on the shore. At the birth of every structure, the highest high and the lowest low of the lookback window are frozen — locked to a fixed bar in the past — and from that moment they do not move. Every angle is measured from calm, settled water toward the storm of the live candle. The reading stays pure: when θ changes, it is because price moved, and for no other reason.
The anchors hold until price closes beyond one of them. That close is the break — the moment the structure completes, is archived with its full geometry, and a fresh pair of anchors freezes for the next chapter.
One naming note, so the chart reads correctly: what GTL labels HH and LL are these frozen anchor levels, not the traditional trailing swing highs and lows.

Solid ground measures the storm precisely; a boat measures mostly itself — GTL is the observer on the shore, and the frozen box below is exactly that shore.
█ WHY 23 — A PRIME WINDOW
The lookback window — the number of bars GTL scans before freezing a new pair of anchors — defaults to 23. The choice is arithmetic, not aesthetic.
23 is prime: its only divisors are 1 and itself. Stated as a condition,
gcd(23, k) = 1 for every k < 23
For a rolling window, that matters mechanically. If a periodic component of length k shorter than the window is present in the data, the window boundary does not keep meeting that component at the same phase. Because 23 and k are coprime, the alignment steps through all k possible phase offsets before it repeats. A composite window gives that protection away: 24 divides cleanly by 2, 3, 4, 6, 8 and 12, so components at those lengths can meet repeated window boundaries at the same phase, allowing anchor placement to inherit regularity from the measuring frame itself.
Engineering solved the same problem with hunting-tooth gear design: tooth counts are chosen coprime so each tooth eventually meshes with every counterpart, instead of the same pairs meeting forever and wearing a repeated pattern into the metal. Periodical cicadas offer a biological analogy — 13- and 17-year emergence cycles, both prime, reduce overlap with shorter recurring cycles.
This is a design principle stated in number theory, not a performance claim. A prime window does not make GTL better by itself, and it does not prove anything about future price. It simply reduces one avoidable source of arithmetic resonance, so repetition in the readings is less likely to be created by the measuring window. The lookback remains a user input; 23 is the default I stand behind.

Every window from 20 to 25 shares a divisor with at least one shorter cycle length — 23 is the only empty row, which is exactly why it is the default.
█ HOW THIS SERIES IS BUILT — CSV OUT, ANALYSIS IN
This episode follows a working method I now treat as the standard for the whole series: nothing ships on intuition alone. The indicator exports its own internal life — every angle, every structure, every break — as plain columns in the Data Window, ready for CSV export. Before publication, those exports were analyzed with AI assistance across a deliberately diverse panel:
7 instruments × 2 timeframes = 14 datasets
gold, Bitcoin, Tesla, Brent crude, Turkish Airlines, Dogecoin, Saudi Aramco
30-minute and 3-minute bars — roughly 550,000 bars, ~30,000 completed structures
What came back from that study entered the code as design decisions, not as promises. Exactly five constants in the learning layer are hard-coded. They are not presented as universal truths or performance guarantees; they are documented design constants selected from the development study and kept fixed so the live model remains transparent and reproducible:
CAL_LAMBDA = 0.999 — fading-factor decay for the calibration counters
CAL_JUMPTH = 2.0 — empirical jumpiness threshold between steady and choppy estimates
CAL_MINW = 30 — minimum effective sample weight before a calibration cell is trusted
CAL_ROLL = 20 — length of the live recent-record window
JUMP_WIN = 5 — bars used for the short-term stability measurement
The methods behind the layer are standard enough to be named — fading-factor prequential counting for online calibration, adaptive Gaussian KDE for local probability estimation, and Kish-style effective sample size for weighted evidence — and the next section walks through each of them with its reference. The fixed values above are GTL's calibrated defaults from that study, not claims that these numbers are optimal for every market, symbol, or timeframe. Everything else the statistics need — bandwidth, confidence, significance — is computed live from the chart's own history.
Two honest disclosures. First, this analysis is development documentation, not an independent audit, and this description makes no accuracy claims from it. Second, the same door is open to you: every column used in that study is exported by the script itself, so you can pull the CSV from your own chart and put the same questions to any tool you trust.

The build loop of this series: the script exports its own life as CSV, analysis turns it into five documented design constants, and the same door stays open to every user.
█ FROM GEOMETRY TO STATISTICS — THE MATH, WITH ITS REFERENCES
An angle is a measurement; an estimate is a statement. Moving from one to the other honestly requires statistics. GTL does not present this layer as a private invention. It combines established statistical components, named here with their sources, and applies them to one specific object: the geometry of frozen price structures.
Volatility normalization. The σ in the ICS y-axis comes from the Yang-Zhang volatility estimator (Yang & Zhang, Journal of Business, 2000). It uses open, high, low and close data, including overnight, open-to-close and Rogers-Satchell-style range components. In GTL, this is what lets angles be measured in volatility-normalized space instead of raw price units.
Local probability. While a structure is alive, its current angle pair (θC, θF) is compared with archived breaks. Each historical break receives a Gaussian weight that decays with distance in angle space. This is a Gaussian KDE-style local weighting scheme. Its bandwidth follows Silverman's rule-of-thumb logic for two dimensions, h = σ̂ · n^(−1/6), recomputed from the chart's own history. Nothing is manually tuned.
Honest sample size. Weighted evidence can look larger than it really is: many tiny weights are not the same as many strong neighbors. GTL therefore uses the Kish effective sample size (Kish, Survey Sampling, 1965),
n_eff = (Σw)² / Σw²
to estimate how much effective evidence the weighted neighborhood actually contains.
Probability with humility. The weighted up/down vote is passed through a Beta(1,1) posterior, using n_eff as the effective evidence scale. The label only speaks when the posterior mean clears a one-sided 95% normal-approximation check against the 50/50 baseline. When that threshold is not met, the label does not force a call; it simply says the structure is too close to call.
Verification. The principle that probability forecasts must be scored against what actually happened goes back to Brier's 1950 paper in Monthly Weather Review, "Verification of Forecasts Expressed in Terms of Probability." In GTL, every estimate is graded when the break reveals the outcome.
Online calibration. Graded outcomes update fading-factor prequential counters, following the stream-learning evaluation framework of Gama, Sebastião and Rodrigues (Machine Learning, 2013). Fresh evidence receives more weight, while older evidence decays with λ = 0.999. The display can therefore show both the raw estimate and how estimates of the same kind have behaved on the current chart.
Stability. GTL also tracks estimate "jumpiness": the population standard deviation of the last five probability readings. The term and the general idea come from ensemble-forecast consistency research, especially Zsóter, Buizza and Richardson (Monthly Weather Review, 2009). GTL uses a chart-specific adaptation of that idea: a steady estimate and a choppy estimate are labeled differently, because a choppy estimate may still flip.
Nothing in this chain is exotic, and none of it is a performance guarantee. The original part is where the chain is pointed: at frozen structural geometry, measured inside a dimensionless coordinate space.
█ WHAT YOU SEE ON THE CHART
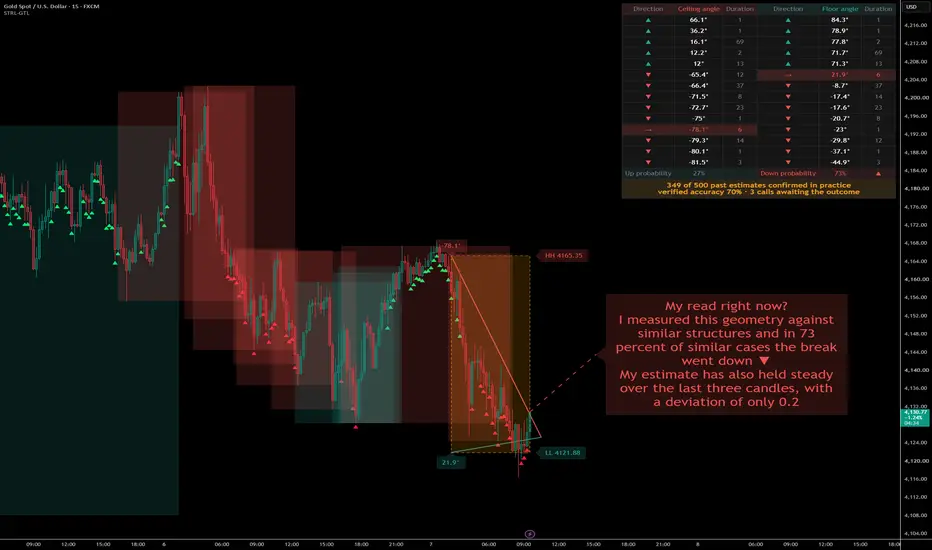
Frozen anchors. Two dashed horizontal lines mark the frozen HH and LL of the current structure, each with its exact level, and a dotted vertical line marks the anchor bar in the past where the freeze happened. These lines do not trail price — that is the whole point.
Geometric trend lines. Two solid lines run from the anchors to the live candle: ceiling from HH to the current high, floor from LL to the current low. They are the triangle hypotenuses. When the two lines converge, they stop at their intersection instead of crossing. The live θC and θF values sit as labels at the anchor.
Structure boxes. Every completed structure is archived as a box: one border color for structures that broke up, another for structures that broke down, and a dashed box for the structure still being built. How many past boxes you see is your choice.
Angle map. A table sorts the recent breaks by their break angles — ceiling side and floor side, each with direction and duration. An arrow row shows where the current live reading ranks among them, so you can literally see where "now" sits in the break history. The footer row carries the up/down estimate; once the calibration cell has enough samples, it shows two numbers, raw → calibrated.
Estimate label. A label floats ahead of the last candle and speaks in sentences: which direction the odds favor, what signals of this kind have actually done on this chart (or the estimated odds while calibration is still warming up), whether the signal is steady or choppy, and a living record — how many of the last 20 estimates were right. It only takes a side when the significance check passes; otherwise it says, honestly, that the structure is too close to call.
The pending phase. Between a break and the next freeze, preview anchors appear as dotted gray lines, the table shows an hourglass, and the estimate quietly switches to a second model trained on pending-phase angles to estimate the direction of the NEXT structure's break.
One disclosure that matters: on the live bar, angles and estimates can change until the candle closes. Everything the indicator learns from — and every alert it fires — reads confirmed bars only.
█ UNDER THE CHART — 29 EXPORTED COLUMNS
Everything drawn above is only a rendering. The numbers underneath are all exported to the Data Window, which means TradingView's "Export chart data" hands you a complete CSV audit trail:
Live geometry & estimate, every bar:
Ceiling θ / Floor θ — the two live angles in ICS
Probability UP / Probability DOWN — the per-bar estimate (these two are also plots, so you can build threshold alerts on them directly)
Log Jump Bar — the stability (jumpiness) of the estimate
Log Cell Bar — which calibration cell this bar fell into
Structure snapshot, printed on every break bar:
Str Duration — how many bars the structure lived
Str Frozen HH / Str Frozen LL — the anchor levels
Str Max High / Str Min Low — the extremes reached inside
Str θ Ceil max / Str θ Floor MIN — the angles at those extremes
Str Break Dir — +1 up, −1 down
Estimate audit trail, on birth and break events:
Log Event — 1 = birth, 2 = break, 3 = both on one bar
Log θC Birth / Log θF Birth / Log P Birth / Log Sig Birth / Log nEff Birth — the forecast made the moment the structure was born
Log θC Pend / Log θF Pend / Log P Pend / Log Sig Pend / Log nEff Pend — the pending-phase forecast carried into this break
Log Hit Birth / Log Hit Pend — each forecast graded 1 or 0 against the actual break
Log Acc Birth / Log Acc Pend — the running accuracy of each estimate type
This is the same door the development study walked through. Export the CSV from your own chart, open it in a spreadsheet, in Python, or hand it to an AI assistant — and audit every sentence the label has ever told you.
█ SETTINGS THAT STAY OUT OF YOUR WAY
The settings menu is deliberately small: the lookback window, a few visual choices — colors, transparency, border style, table position, label size and offset, how many past boxes to show — and simple on/off toggles. That is the whole surface, because everything statistical is computed live from the chart itself: the KDE bandwidth from Silverman's rule, the effective sample size from Kish's formula, significance from the posterior, the calibrated rate from the fading counters, the pending-phase model switching in and out on its own. There is nothing to tune, and that is by design. The five documented constants from the development study are the only fixed numbers in the machine.
█ ALERTS
Three alerts cover the estimate's life cycle: Signal turns up, Signal turns down, and Signal gets choppy. Each fires once, on entering its state, and reads only confirmed bars — so what fired is what you will still see on the closed candle. For custom thresholds, Probability UP and Probability DOWN are exposed as plots: build Crossing Up or Greater Than alerts on them directly in TradingView's alert dialog, at any level you like, as many as you like. Recommended frequency: Once Per Bar Close.
█ SEVENTEEN LANGUAGES
The angle map, the anchor labels and the estimate label speak 17 languages: English, Türkçe, Deutsch, Italiano, Français, Español, Bahasa Indonesia, Bahasa Melayu, Ελληνικά, Русский, 中文, 日本語, 한국어, हिन्दी, العربية, فارسی and עברית. Right-to-left scripts — Arabic, Persian, Hebrew — mirror the table layout automatically. One honest limitation: input settings and alert messages stay in English, because Pine requires compile-time constant strings there.
█ WHAT THIS IS — AND WHAT IT IS NOT
GTL is a research and structural analysis tool. It measures the geometry of frozen price structures, keeps honest statistics about its own estimates, and shows you both — the raw number and the track record, side by side. It is not a trading system, its estimates are not trade signals, and nothing in this script or this description is financial advice. The calibrated rates describe what has already happened on your chart's own history; they are not a promise about the next bar. On the live candle, readings can change until the close — confirmed statistics and learning update on closed bars only.
Read it the way it was built to be read: as an instrument standing on the shore, measuring the storm.
GTL is a research indicator that studies the geometry of price structures. It freezes structural anchors in the past, stretches two right-triangles between those anchors and the live candle, and reads their angles inside a dimensionless coordinate space — then learns from every completed structure to estimate, with calibrated statistics, which way the current one is leaning. It is a structural analysis and research tool, not a trading system.
█ STEP OUT OF THE CHART PLANE
Every trader has drawn a trendline and called it steep. Steep compared to what? Stretch the chart window and the angle flattens. Jump from Bitcoin to a quiet blue-chip stock and a "45-degree rally" becomes a completely different animal. The chart plane mixes two quantities that were never meant to share axes — price and time — so any angle drawn on it is a property of your zoom level, not of the market.
My standard, before any geometry begins, is to take the shape out of the chart plane entirely. GTL maps every point into an Isotropic Coordinate System (ICS) where both axes are pure numbers:
y = log(price) / σ
x = bars / lookback
Price is expressed in units of the instrument's own volatility (σ, estimated with the Yang-Zhang method over 500 bars), and time in units of the analysis window. Nothing on either axis carries dollars, lira, satoshis or minutes anymore.
In this space, a degree finally means something. The angle
θ = atan(Δy / Δx) × 180 / π
is intrinsic: a 60° ceiling angle on gold's 30-minute chart describes the same geometric event as a 60° ceiling angle on a 3-minute meme-coin chart. The instrument's personality — its price level, its tick size, its temperament — has been normalized away, and what remains is pure trajectory. Everything else in this indicator stands on that ground.
The same rally, two zoom levels, two different angles — and on the right, the dimensionless ICS home where θ finally becomes a property of the market, not of your screen.
█ THE TRIANGLE — A SHAPE THAT CARRIES DATA
Of all the shapes humanity has leaned on, the triangle is the one that never let us down. It raised the pyramids, it holds every bridge truss and roof frame you have ever walked under, and it is the only polygon that cannot be deformed without changing the length of a side. Engineers call that property rigidity. I read it as trustworthiness — a triangle does not lie about its geometry.
That is why I chose it as the measuring instrument. On every structure, GTL constructs two right-triangles inside ICS:
The ceiling triangle — from the frozen HH anchor to the live candle's high.
The floor triangle — from the frozen LL anchor to the live candle's low.
Each triangle is not a drawing; it is a container. Four measurements live inside it at every bar:
θ — the signed angle of the hypotenuse, the indicator's core reading
Δy — the signed magnitude of the move in volatility units
area — the geometric surface the structure has swept
centroid — the shape's center of mass in ICS
While price grinds below a frozen ceiling, the ceiling angle sinks degree by degree into negative territory. When price presses up from a frozen floor, the floor angle climbs. Two triangles breathe with the market — one watching from above, one from below — and their angles are the raw language everything downstream of this indicator speaks.
One triangle watches from above, one from below — and θ, Δy, area and centroid live inside each of them.
█ AN ANCHOR IN THE PAST — MEASURING FROM CALM WATER
Picture a storm at sea, and two people trying to measure the waves. One stands on the shore. One sits in a boat, right among them. The observer on the shore, feet on solid ground, reads the height of every wave with precision — however wild the water gets, the ground beneath him does not move. The observer in the boat rises and falls with the very thing he is trying to measure; every number he writes down is contaminated by his own motion.
Most swing-based tools are the observer in the boat. Their reference points — the latest swing high, the latest swing low — are redefined by the market again and again, so any angle or distance measured from them mixes two movements at once: the price's, and the reference's own.
GTL plants its observer on the shore. At the birth of every structure, the highest high and the lowest low of the lookback window are frozen — locked to a fixed bar in the past — and from that moment they do not move. Every angle is measured from calm, settled water toward the storm of the live candle. The reading stays pure: when θ changes, it is because price moved, and for no other reason.
The anchors hold until price closes beyond one of them. That close is the break — the moment the structure completes, is archived with its full geometry, and a fresh pair of anchors freezes for the next chapter.
One naming note, so the chart reads correctly: what GTL labels HH and LL are these frozen anchor levels, not the traditional trailing swing highs and lows.
Solid ground measures the storm precisely; a boat measures mostly itself — GTL is the observer on the shore, and the frozen box below is exactly that shore.
█ WHY 23 — A PRIME WINDOW
The lookback window — the number of bars GTL scans before freezing a new pair of anchors — defaults to 23. The choice is arithmetic, not aesthetic.
23 is prime: its only divisors are 1 and itself. Stated as a condition,
gcd(23, k) = 1 for every k < 23
For a rolling window, that matters mechanically. If a periodic component of length k shorter than the window is present in the data, the window boundary does not keep meeting that component at the same phase. Because 23 and k are coprime, the alignment steps through all k possible phase offsets before it repeats. A composite window gives that protection away: 24 divides cleanly by 2, 3, 4, 6, 8 and 12, so components at those lengths can meet repeated window boundaries at the same phase, allowing anchor placement to inherit regularity from the measuring frame itself.
Engineering solved the same problem with hunting-tooth gear design: tooth counts are chosen coprime so each tooth eventually meshes with every counterpart, instead of the same pairs meeting forever and wearing a repeated pattern into the metal. Periodical cicadas offer a biological analogy — 13- and 17-year emergence cycles, both prime, reduce overlap with shorter recurring cycles.
This is a design principle stated in number theory, not a performance claim. A prime window does not make GTL better by itself, and it does not prove anything about future price. It simply reduces one avoidable source of arithmetic resonance, so repetition in the readings is less likely to be created by the measuring window. The lookback remains a user input; 23 is the default I stand behind.
Every window from 20 to 25 shares a divisor with at least one shorter cycle length — 23 is the only empty row, which is exactly why it is the default.
█ HOW THIS SERIES IS BUILT — CSV OUT, ANALYSIS IN
This episode follows a working method I now treat as the standard for the whole series: nothing ships on intuition alone. The indicator exports its own internal life — every angle, every structure, every break — as plain columns in the Data Window, ready for CSV export. Before publication, those exports were analyzed with AI assistance across a deliberately diverse panel:
7 instruments × 2 timeframes = 14 datasets
gold, Bitcoin, Tesla, Brent crude, Turkish Airlines, Dogecoin, Saudi Aramco
30-minute and 3-minute bars — roughly 550,000 bars, ~30,000 completed structures
What came back from that study entered the code as design decisions, not as promises. Exactly five constants in the learning layer are hard-coded. They are not presented as universal truths or performance guarantees; they are documented design constants selected from the development study and kept fixed so the live model remains transparent and reproducible:
CAL_LAMBDA = 0.999 — fading-factor decay for the calibration counters
CAL_JUMPTH = 2.0 — empirical jumpiness threshold between steady and choppy estimates
CAL_MINW = 30 — minimum effective sample weight before a calibration cell is trusted
CAL_ROLL = 20 — length of the live recent-record window
JUMP_WIN = 5 — bars used for the short-term stability measurement
The methods behind the layer are standard enough to be named — fading-factor prequential counting for online calibration, adaptive Gaussian KDE for local probability estimation, and Kish-style effective sample size for weighted evidence — and the next section walks through each of them with its reference. The fixed values above are GTL's calibrated defaults from that study, not claims that these numbers are optimal for every market, symbol, or timeframe. Everything else the statistics need — bandwidth, confidence, significance — is computed live from the chart's own history.
Two honest disclosures. First, this analysis is development documentation, not an independent audit, and this description makes no accuracy claims from it. Second, the same door is open to you: every column used in that study is exported by the script itself, so you can pull the CSV from your own chart and put the same questions to any tool you trust.
The build loop of this series: the script exports its own life as CSV, analysis turns it into five documented design constants, and the same door stays open to every user.
█ FROM GEOMETRY TO STATISTICS — THE MATH, WITH ITS REFERENCES
An angle is a measurement; an estimate is a statement. Moving from one to the other honestly requires statistics. GTL does not present this layer as a private invention. It combines established statistical components, named here with their sources, and applies them to one specific object: the geometry of frozen price structures.
Volatility normalization. The σ in the ICS y-axis comes from the Yang-Zhang volatility estimator (Yang & Zhang, Journal of Business, 2000). It uses open, high, low and close data, including overnight, open-to-close and Rogers-Satchell-style range components. In GTL, this is what lets angles be measured in volatility-normalized space instead of raw price units.
Local probability. While a structure is alive, its current angle pair (θC, θF) is compared with archived breaks. Each historical break receives a Gaussian weight that decays with distance in angle space. This is a Gaussian KDE-style local weighting scheme. Its bandwidth follows Silverman's rule-of-thumb logic for two dimensions, h = σ̂ · n^(−1/6), recomputed from the chart's own history. Nothing is manually tuned.
Honest sample size. Weighted evidence can look larger than it really is: many tiny weights are not the same as many strong neighbors. GTL therefore uses the Kish effective sample size (Kish, Survey Sampling, 1965),
n_eff = (Σw)² / Σw²
to estimate how much effective evidence the weighted neighborhood actually contains.
Probability with humility. The weighted up/down vote is passed through a Beta(1,1) posterior, using n_eff as the effective evidence scale. The label only speaks when the posterior mean clears a one-sided 95% normal-approximation check against the 50/50 baseline. When that threshold is not met, the label does not force a call; it simply says the structure is too close to call.
Verification. The principle that probability forecasts must be scored against what actually happened goes back to Brier's 1950 paper in Monthly Weather Review, "Verification of Forecasts Expressed in Terms of Probability." In GTL, every estimate is graded when the break reveals the outcome.
Online calibration. Graded outcomes update fading-factor prequential counters, following the stream-learning evaluation framework of Gama, Sebastião and Rodrigues (Machine Learning, 2013). Fresh evidence receives more weight, while older evidence decays with λ = 0.999. The display can therefore show both the raw estimate and how estimates of the same kind have behaved on the current chart.
Stability. GTL also tracks estimate "jumpiness": the population standard deviation of the last five probability readings. The term and the general idea come from ensemble-forecast consistency research, especially Zsóter, Buizza and Richardson (Monthly Weather Review, 2009). GTL uses a chart-specific adaptation of that idea: a steady estimate and a choppy estimate are labeled differently, because a choppy estimate may still flip.
Nothing in this chain is exotic, and none of it is a performance guarantee. The original part is where the chain is pointed: at frozen structural geometry, measured inside a dimensionless coordinate space.
█ WHAT YOU SEE ON THE CHART
Frozen anchors. Two dashed horizontal lines mark the frozen HH and LL of the current structure, each with its exact level, and a dotted vertical line marks the anchor bar in the past where the freeze happened. These lines do not trail price — that is the whole point.
Geometric trend lines. Two solid lines run from the anchors to the live candle: ceiling from HH to the current high, floor from LL to the current low. They are the triangle hypotenuses. When the two lines converge, they stop at their intersection instead of crossing. The live θC and θF values sit as labels at the anchor.
Structure boxes. Every completed structure is archived as a box: one border color for structures that broke up, another for structures that broke down, and a dashed box for the structure still being built. How many past boxes you see is your choice.
Angle map. A table sorts the recent breaks by their break angles — ceiling side and floor side, each with direction and duration. An arrow row shows where the current live reading ranks among them, so you can literally see where "now" sits in the break history. The footer row carries the up/down estimate; once the calibration cell has enough samples, it shows two numbers, raw → calibrated.
Estimate label. A label floats ahead of the last candle and speaks in sentences: which direction the odds favor, what signals of this kind have actually done on this chart (or the estimated odds while calibration is still warming up), whether the signal is steady or choppy, and a living record — how many of the last 20 estimates were right. It only takes a side when the significance check passes; otherwise it says, honestly, that the structure is too close to call.
The pending phase. Between a break and the next freeze, preview anchors appear as dotted gray lines, the table shows an hourglass, and the estimate quietly switches to a second model trained on pending-phase angles to estimate the direction of the NEXT structure's break.
One disclosure that matters: on the live bar, angles and estimates can change until the candle closes. Everything the indicator learns from — and every alert it fires — reads confirmed bars only.
█ UNDER THE CHART — 29 EXPORTED COLUMNS
Everything drawn above is only a rendering. The numbers underneath are all exported to the Data Window, which means TradingView's "Export chart data" hands you a complete CSV audit trail:
Live geometry & estimate, every bar:
Ceiling θ / Floor θ — the two live angles in ICS
Probability UP / Probability DOWN — the per-bar estimate (these two are also plots, so you can build threshold alerts on them directly)
Log Jump Bar — the stability (jumpiness) of the estimate
Log Cell Bar — which calibration cell this bar fell into
Structure snapshot, printed on every break bar:
Str Duration — how many bars the structure lived
Str Frozen HH / Str Frozen LL — the anchor levels
Str Max High / Str Min Low — the extremes reached inside
Str θ Ceil max / Str θ Floor MIN — the angles at those extremes
Str Break Dir — +1 up, −1 down
Estimate audit trail, on birth and break events:
Log Event — 1 = birth, 2 = break, 3 = both on one bar
Log θC Birth / Log θF Birth / Log P Birth / Log Sig Birth / Log nEff Birth — the forecast made the moment the structure was born
Log θC Pend / Log θF Pend / Log P Pend / Log Sig Pend / Log nEff Pend — the pending-phase forecast carried into this break
Log Hit Birth / Log Hit Pend — each forecast graded 1 or 0 against the actual break
Log Acc Birth / Log Acc Pend — the running accuracy of each estimate type
This is the same door the development study walked through. Export the CSV from your own chart, open it in a spreadsheet, in Python, or hand it to an AI assistant — and audit every sentence the label has ever told you.
█ SETTINGS THAT STAY OUT OF YOUR WAY
The settings menu is deliberately small: the lookback window, a few visual choices — colors, transparency, border style, table position, label size and offset, how many past boxes to show — and simple on/off toggles. That is the whole surface, because everything statistical is computed live from the chart itself: the KDE bandwidth from Silverman's rule, the effective sample size from Kish's formula, significance from the posterior, the calibrated rate from the fading counters, the pending-phase model switching in and out on its own. There is nothing to tune, and that is by design. The five documented constants from the development study are the only fixed numbers in the machine.
█ ALERTS
Three alerts cover the estimate's life cycle: Signal turns up, Signal turns down, and Signal gets choppy. Each fires once, on entering its state, and reads only confirmed bars — so what fired is what you will still see on the closed candle. For custom thresholds, Probability UP and Probability DOWN are exposed as plots: build Crossing Up or Greater Than alerts on them directly in TradingView's alert dialog, at any level you like, as many as you like. Recommended frequency: Once Per Bar Close.
█ SEVENTEEN LANGUAGES
The angle map, the anchor labels and the estimate label speak 17 languages: English, Türkçe, Deutsch, Italiano, Français, Español, Bahasa Indonesia, Bahasa Melayu, Ελληνικά, Русский, 中文, 日本語, 한국어, हिन्दी, العربية, فارسی and עברית. Right-to-left scripts — Arabic, Persian, Hebrew — mirror the table layout automatically. One honest limitation: input settings and alert messages stay in English, because Pine requires compile-time constant strings there.
█ WHAT THIS IS — AND WHAT IT IS NOT
GTL is a research and structural analysis tool. It measures the geometry of frozen price structures, keeps honest statistics about its own estimates, and shows you both — the raw number and the track record, side by side. It is not a trading system, its estimates are not trade signals, and nothing in this script or this description is financial advice. The calibrated rates describe what has already happened on your chart's own history; they are not a promise about the next bar. On the live candle, readings can change until the close — confirmed statistics and learning update on closed bars only.
Read it the way it was built to be read: as an instrument standing on the shore, measuring the storm.
發行說明
UPDATE. Estimation engine version 2, mobile compact mode and translation refinements.WHAT'S NEW IN THIS UPDATE
ENGINE
The estimation engine has been rebuilt around one honest number. Internally the indicator computes two different values. The first is the raw probability, the direct output of the geometric model. It says that the geometry of this moment resembles archived structures of which, for example, 93 percent broke upward. Like any model, this claim can be overconfident. The second is the verified class rate, the real track record of moments of the same class, graded only after each break resolved. It says that moments like this one were actually right, for example, 74 percent of the time.
Starting with this version, only the second number is ever displayed. The raw probability still works behind the scenes, selecting the signal class and feeding the significance test, but it never appears on the chart. The number you read on the label and in the table is always a proven track record, not a theoretical guess.
The calibration archive is also finer now. Every reading is filed into one of 20 signal classes, ten confidence bins by two stability states, and each class keeps its own live hit rate with fading memory. The design was validated on 14 datasets containing 30,288 structures and improved calibration error over the previous design.
A direction is claimed only when four gates pass on the confirmed bar. The estimate must be stable over the last five candles, the geometric reading must be statistically significant, the class must hold at least 30 graded samples, and the class rate itself must pass a Wald significance test. When any gate fails, the label explains exactly why the model stays silent, with its real diagnostics, across nine honest states. Alerts follow the same gates and remain repaint free.
MOBILE
A new Mobile compact mode switch has been added to the settings, off by default. When it is on, the angle map table is hidden and the long estimate label shrinks to a small badge showing only the direction and the verified number. One tap on the badge opens the full message, exactly the same sentence the model shows on desktop, in your selected display language. Nothing changes in the engine, the learning or the alerts.
TRANSLATIONS
Several of the 17 display languages were refined for accuracy and natural phrasing based on native context review, including Persian, Turkish, Indonesian and Malay. . Every message now reads correctly and idiomatically in its own language.
No user action is needed.
發行說明
What's newTighter stability detection
The stability window has been shortened from 5 candles to 3, and the threshold lowered from 2.0 to 1.5. Re-validated on 14 datasets: the model now speaks on 54% of eligible bars (up from 46%) with no loss in accuracy. Moments that were previously held back as "swinging too much" now get evaluated sooner.
Verified track record
Every full directional call the model makes on a confirmed candle is now recorded internally. When the structure eventually breaks, the actual direction grades each stored call as right or wrong. The last 500 graded calls are kept in a rolling window, and the result is displayed as a new row at the bottom of the Angle Map table: how many were right, out of how many, and the running accuracy percentage. Calls that are still waiting for the structure to resolve are counted separately.
Signal trace
Three new optional toggles let you see the model's historical decisions directly on the chart. A neon green triangle marks each candle where the model made a full UP call, a red triangle marks each DOWN call, and a silver triangle marks candles that were evaluated but received no directional call. All markers are repaint-free and read from the confirmed bar log only.
XAUUSD daily — Signal trace: UP calls. Green triangles below each candle where the model made a full directional call upward. The track record row shows 427 of 500 confirmed at 85% accuracy, with 3 calls still awaiting the outcome.
BTCUSD 10 min — Signal trace: DOWN calls. Red triangles mark confirmed candles where the model called downward. The live label shows a full call at 67% down probability with a steady deviation of 1.4.
AAPL 15 min — Signal trace: silent bars. Silver triangles mark confirmed candles that were evaluated but received no directional call. The track record reads 427 of 500 at 85% accuracy, with 15 calls awaiting the outcome of the current structure.
Estimate label positioning
The floating estimate label now anchors to the midpoint of the active structure instead of the close price, and uses bar-index positioning instead of time-based. This keeps the label visually tied to the structure it describes and prevents misplacement on instruments with time gaps such as stocks and futures.
Probability always on
The separate "Break-bias estimate" toggle has been removed. The probability engine is now always active because it is integral to the model's decision ladder. This simplifies the settings without changing any behavior for users who already had it enabled.
Data window and CSV export
Every column in the data window can be exported as CSV from TradingView and fed into external tools, including AI and machine-learning pipelines. Two new columns have been added in this update: "Track Accuracy" and "Track Count," which log the model's rolling verified accuracy at each structure break. The full set of exportable columns:
Per-bar geometry
Ceiling θ — ceiling triangle angle on each bar
Floor θ — floor triangle angle on each bar
Probability UP / DOWN — the model's directional estimate for each bar
Structure snapshot (populated once at each break)
Str Duration — how many bars the structure lasted
Str Frozen HH / LL — the anchors that defined the structure
Str Max High / Min Low — the extreme prices reached inside the structure
Str θ Ceil max / θ Floor MIN — the angles at the moment price hit those extremes
Str Break Dir — which side broke: +1 up, −1 down
Model diagnostics (per confirmed bar)
Log State Bar — the decision-ladder state (1 newborn, 2 unstable, 3 too close, 4 cold class, 5 neutral record, 6 full call)
Calibrated Rate — the class hit rate the model displays when it speaks
Log Jump Bar — stability deviation over the last three candles
Log Cell Bar — which calibration cell the bar fell into
Birth and pending estimates
Log Event — event type: 1 birth, 2 break, 3 both on the same bar
Log θC/θF Birth — ceiling and floor angles at the moment the structure was born
Log P Birth / Sig Birth / nEff Birth — the birth forecast, its significance, and effective sample size
Log θC/θF Pend — ceiling and floor angles measured against the preview anchors at the break
Log P Pend / Sig Pend / nEff Pend — the pending-mode forecast for the next structure
Accuracy logs
Log Hit Pend / Hit Birth — whether the pending or birth forecast was correct (1/0)
Log Acc Pend / Acc Birth — cumulative accuracy of pending and birth forecasts
Track Accuracy (new) — rolling verified accuracy of full directional calls at each break
Track Count (new) — number of graded calls in the rolling window at that point
開源腳本
秉持TradingView一貫精神,這個腳本的創作者將其設為開源,以便交易者檢視並驗證其功能。向作者致敬!您可以免費使用此腳本,但請注意,重新發佈代碼需遵守我們的社群規範。

Measuring markets through Volume Dynamics & Geometric Frameworks.
For invite-only script access, DM on TradingView or via x.com/sabanci_ata
For invite-only script access, DM on TradingView or via x.com/sabanci_ata
免責聲明
這些資訊和出版物並非旨在提供,也不構成TradingView提供或認可的任何形式的財務、投資、交易或其他類型的建議或推薦。請閱讀使用條款以了解更多資訊。
開源腳本
秉持TradingView一貫精神,這個腳本的創作者將其設為開源,以便交易者檢視並驗證其功能。向作者致敬!您可以免費使用此腳本,但請注意,重新發佈代碼需遵守我們的社群規範。
Measuring markets through Volume Dynamics & Geometric Frameworks.
For invite-only script access, DM on TradingView or via x.com/sabanci_ata
For invite-only script access, DM on TradingView or via x.com/sabanci_ata
免責聲明
這些資訊和出版物並非旨在提供,也不構成TradingView提供或認可的任何形式的財務、投資、交易或其他類型的建議或推薦。請閱讀使用條款以了解更多資訊。