OPEN-SOURCE SCRIPT
Dynamic Anchored BB (RSI reset selectable)
🔵 Overview 🔵
🔵 How it works 🔵
🔵 How to use 🔵
🔵 Notes 🔵
Sometimes, rather than using Bollinger Bands based on a fixed, static period, you might want to plot them starting from a specific trigger point.
This indicator plots Bollinger Bands that originate at points where the RSI reaches 80 or higher (or, 20 or lower); the look-back period expands with each subsequent bar.
🔵 How it works 🔵
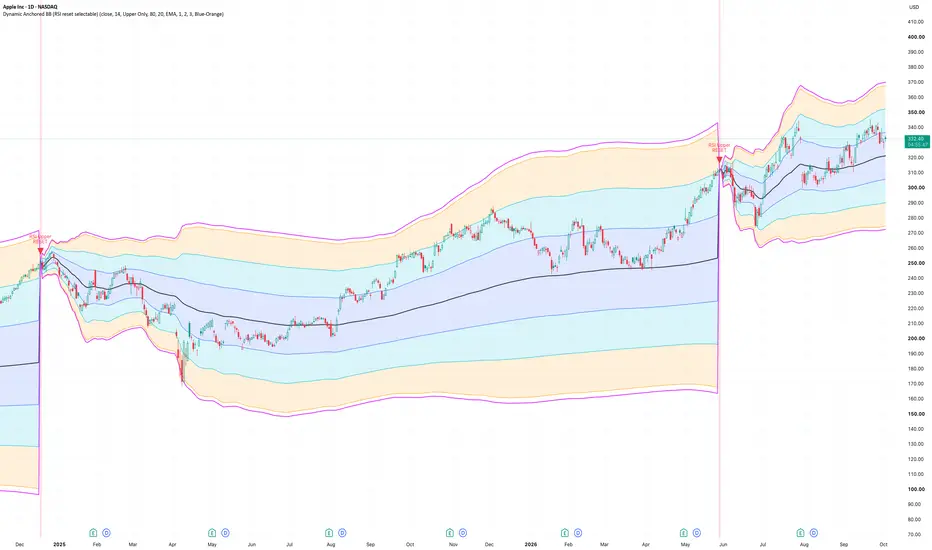
Please take a look at the chart above. It shows the display with the "Upper Only" setting and the EMA selected for the moving average.
Starting from the point where the RSI reaches 80, the Bollinger Bands' period extends progressively with each passing bar; this continues until the RSI reaches 80 again.
This indicator views the market not as something static, but as a dynamic, living entity driven by specific events; it maps the starting point of a separate trend indicator—in this case, the RSI—onto the Bollinger Bands.
You can observe a clear correlation between the price's position relative to the Bollinger Bands and the actual price movement as the bars progress.
The image below shows the "Upper and Lower" display option.
🔵 How to use 🔵
Please open the settings and configure the values and options according to your preferences:
- Choose the price source: close, ohlc4, or another option.
- RSI length: the default is set to the standard 14.
- Reset mode: select whether the reset is triggered by reaching the Upper level, the Lower level, or both.
- Specify the threshold values for both the Upper and Lower levels.
- Base MA: select the type of moving average to serve as the basis for the Bollinger Bands.
- You can adjust the Bollinger Bands' standard deviation value. An option to plot pi (3.14) is also included.
- Three color schemes are available.
🔵 Notes 🔵
This indicator can be used on charts for any asset and any timeframe.
開源腳本
秉持TradingView一貫精神,這個腳本的創作者將其設為開源,以便交易者檢視並驗證其功能。向作者致敬!您可以免費使用此腳本,但請注意,重新發佈代碼需遵守我們的社群規範。

免責聲明
這些資訊和出版物並非旨在提供,也不構成TradingView提供或認可的任何形式的財務、投資、交易或其他類型的建議或推薦。請閱讀使用條款以了解更多資訊。
免責聲明
這些資訊和出版物並非旨在提供,也不構成TradingView提供或認可的任何形式的財務、投資、交易或其他類型的建議或推薦。請閱讀使用條款以了解更多資訊。