Quasimodo QM Pattern, QML, BOS & Liquidity Sweep [LunqFX]
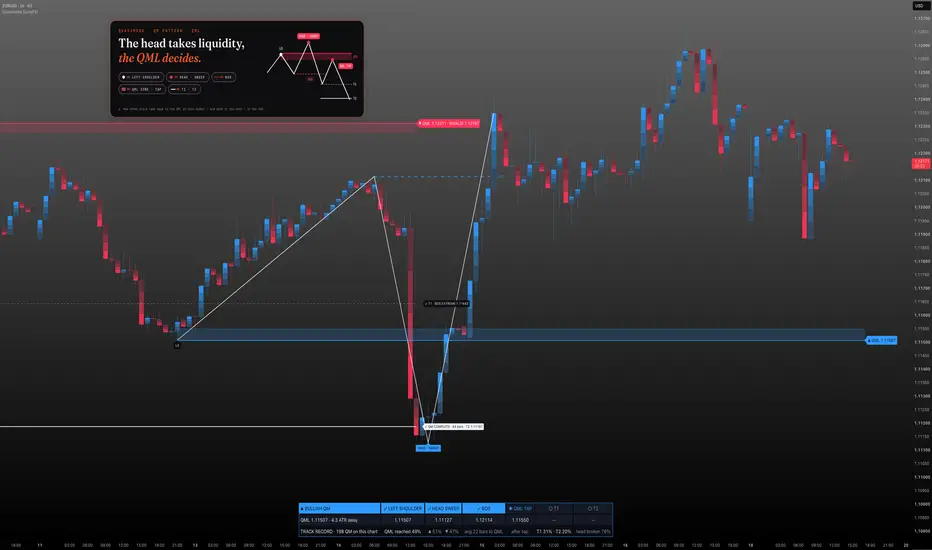
Quasimodo QM Pattern finds the quasimodo, the price action reversal pattern that smart money concepts (SMC) traders also call the QM or over-and-under: a left shoulder, a head that sweeps the shoulder's liquidity, and a break of structure (BOS) in the other direction. It draws the QM level (QML) at the left shoulder and then follows what price does next: whether it comes back to the QML, and from there whether it reaches the targets or breaks the head. Every finished pattern is filed, and a HUD at the bottom of the chart shows how the quasimodo has actually played out on this symbol.
Most quasimodo indicators draw the pattern the moment it appears and stop there. Whether price ever returns to the QML, how long that takes, and how often the move continues from it are left to guesswork. This one runs every QM to its end and keeps the score: the share of patterns whose QML was reached, the average wait, and — after the tap — how often T1 and T2 were hit and how often the head gave way. You see whether the QML is worth waiting for on this market before you wait for it.
❶ THE QUASIMODO, STEP BY STEP ① LEFT SHOULDER (LS) — a confirmed swing high (bearish QM) or swing low (bullish QM). ② HEAD · SWEEP — the next swing in the same direction goes beyond the left shoulder by at least the minimum sweep, taking the liquidity resting there. ③ BOS — price closes through the swing between the shoulder and the head. That middle swing must sit on the near side of the left shoulder (below it for a bearish QM, above it for a bullish one), otherwise the three swings are not a quasimodo. The structure has broken the other way; the QM is formed. ④ QML TAP — price comes back into the QML zone at the left shoulder's level. This is the over-and-under retest the pattern is traded from. ⑤ T1 / T2 — the targets of the move that follows.
❷ LEVELS ▸ QML — the left shoulder's extreme, drawn as a line with a zone that reaches back toward price by a set fraction of ATR ▸ T1 · BOS EXTREME — the furthest point of the break-of-structure leg ▸ T2 · LEG PROJECTION — the head-to-BOS leg measured again from the QML ▸ INVALID — the head. A close beyond it ends the pattern; once the QML is tapped the level is shown in the QML label (QML … · INVALID …), with a dotted line Each target gets a ✓ when it trades. The result is written into the pattern's own labels, so nothing floats loose on the chart: a completed pattern turns its T2 label into "✓ QM COMPLETE · bars", and any other ending is written into the QML label: HEAD BROKEN (after the tap), HEAD BROKEN · no QML tap (before it), EXPIRED (no target and no failure within the bars after the tap), or QML MISSED (price never came back within the waiting window).
❸ THE HUD A single strip at the bottom of the chart, read left to right: ▸ Top row — the stage tracker: LEFT SHOULDER · HEAD SWEEP · BOS · QML TAP · T1 · T2. Finished steps are filled, the current step is marked ◉, the rest are dimmed. ▸ Middle row — the live levels under each step, and how many ATR price is from the QML zone while you wait. ▸ Bottom row — the track record on this chart: how many QMs formed, the share that reached the QML (bullish and bearish separately), the average bars to the QML, and after the tap, the share that hit T1, T2 and the share where the head was broken.
❹ HOW TO USE IT
A new QM appears with the break of structure. The QML zone and line are drawn at the left shoulder, and the HUD shows how many ATR price is away from it.
Check the track record: if the QML is rarely reached on this symbol, a missed retest is the normal case here.
When price taps the QML, T1, T2 and the invalidation level are drawn. Use your own entry rules for timing and risk.
A higher-timeframe level at the head (an old high or low, an order block, a fair value gap) is the classic SMC context for a quasimodo; the market structure around it is part of your own analysis.
Works on forex, gold (XAUUSD), index CFDs and crypto, from 1 minute to the daily chart.
❺ SETTINGS Pattern ▸ Swing strength — bars on each side that confirm a swing; higher finds bigger, fewer patterns ▸ Min. head sweep (× ATR) — how far the head must go beyond the left shoulder ▸ QML zone depth (× ATR) — how far the QML zone reaches back toward price; a trade into it counts as the tap ▸ Bars to wait for the QML tap · Bars after the tap Drawing ▸ Pattern legs (LS → H → BOS) · QML zone · Targets and invalidation ▸ Patterns drawn — how many finished patterns stay on the chart; the track record keeps all of them ▸ Label size HUD ▸ Show HUD · Position: bottom centre (default), top centre, bottom right or top right · text size Alerts ▸ QM formed (BOS) · QML tapped · Target hit / failed Visuals ▸ Neon candles — electric blue rising, neon red falling; the pattern structure and targets in white. Off = your own chart candles. ▸ Glow candles — each body brightens towards the close. Off = flat neon bodies.
❻ ALERTS ▸ QM formed — with the QML and the head ▸ QML tapped — with T1, T2 and the invalidation level ▸ Target hit, pattern failed Create the alert with "Any alert() function call" for the full messages, or use the four alert conditions.
❼ NON-REPAINTING Swings are confirmed pivots, so a shoulder or a head is known "swing strength" bars after it forms — the pattern is never drawn before its parts exist. The BOS, the QML tap, target hits and failures are decided on closed bars, and no drawing is moved back in time. The script does not use request.security or lookahead.
LIMITATIONS ▸ Swing confirmation delays the pattern: the BOS can only be registered once the head is a confirmed swing. In a fast move the BOS label can appear a few bars after price first crossed the level. ▸ The quasimodo is read from three alternating swings with fixed rules (sweep size, close through the middle swing). Other traders draw the same pattern by eye and may disagree on some of them. ▸ One pattern is tracked at a time; a QM that forms while another is running is not tracked. ▸ The track record covers only the history loaded on your chart, and the "QML reached" share also counts patterns that are still waiting. Small samples are noisy — check how many QMs formed before trusting a percentage. Past rates are not a forecast. ▸ The pattern gives a structure, a level and targets — not an entry. It has no stop loss or position sizing; combine it with your own entry rules and risk management.
This script is for educational purposes only and is not financial advice. Trading involves risk.
Most quasimodo indicators draw the pattern the moment it appears and stop there. Whether price ever returns to the QML, how long that takes, and how often the move continues from it are left to guesswork. This one runs every QM to its end and keeps the score: the share of patterns whose QML was reached, the average wait, and — after the tap — how often T1 and T2 were hit and how often the head gave way. You see whether the QML is worth waiting for on this market before you wait for it.
❶ THE QUASIMODO, STEP BY STEP ① LEFT SHOULDER (LS) — a confirmed swing high (bearish QM) or swing low (bullish QM). ② HEAD · SWEEP — the next swing in the same direction goes beyond the left shoulder by at least the minimum sweep, taking the liquidity resting there. ③ BOS — price closes through the swing between the shoulder and the head. That middle swing must sit on the near side of the left shoulder (below it for a bearish QM, above it for a bullish one), otherwise the three swings are not a quasimodo. The structure has broken the other way; the QM is formed. ④ QML TAP — price comes back into the QML zone at the left shoulder's level. This is the over-and-under retest the pattern is traded from. ⑤ T1 / T2 — the targets of the move that follows.
❷ LEVELS ▸ QML — the left shoulder's extreme, drawn as a line with a zone that reaches back toward price by a set fraction of ATR ▸ T1 · BOS EXTREME — the furthest point of the break-of-structure leg ▸ T2 · LEG PROJECTION — the head-to-BOS leg measured again from the QML ▸ INVALID — the head. A close beyond it ends the pattern; once the QML is tapped the level is shown in the QML label (QML … · INVALID …), with a dotted line Each target gets a ✓ when it trades. The result is written into the pattern's own labels, so nothing floats loose on the chart: a completed pattern turns its T2 label into "✓ QM COMPLETE · bars", and any other ending is written into the QML label: HEAD BROKEN (after the tap), HEAD BROKEN · no QML tap (before it), EXPIRED (no target and no failure within the bars after the tap), or QML MISSED (price never came back within the waiting window).
❸ THE HUD A single strip at the bottom of the chart, read left to right: ▸ Top row — the stage tracker: LEFT SHOULDER · HEAD SWEEP · BOS · QML TAP · T1 · T2. Finished steps are filled, the current step is marked ◉, the rest are dimmed. ▸ Middle row — the live levels under each step, and how many ATR price is from the QML zone while you wait. ▸ Bottom row — the track record on this chart: how many QMs formed, the share that reached the QML (bullish and bearish separately), the average bars to the QML, and after the tap, the share that hit T1, T2 and the share where the head was broken.
❹ HOW TO USE IT
A new QM appears with the break of structure. The QML zone and line are drawn at the left shoulder, and the HUD shows how many ATR price is away from it.
Check the track record: if the QML is rarely reached on this symbol, a missed retest is the normal case here.
When price taps the QML, T1, T2 and the invalidation level are drawn. Use your own entry rules for timing and risk.
A higher-timeframe level at the head (an old high or low, an order block, a fair value gap) is the classic SMC context for a quasimodo; the market structure around it is part of your own analysis.
Works on forex, gold (XAUUSD), index CFDs and crypto, from 1 minute to the daily chart.
❺ SETTINGS Pattern ▸ Swing strength — bars on each side that confirm a swing; higher finds bigger, fewer patterns ▸ Min. head sweep (× ATR) — how far the head must go beyond the left shoulder ▸ QML zone depth (× ATR) — how far the QML zone reaches back toward price; a trade into it counts as the tap ▸ Bars to wait for the QML tap · Bars after the tap Drawing ▸ Pattern legs (LS → H → BOS) · QML zone · Targets and invalidation ▸ Patterns drawn — how many finished patterns stay on the chart; the track record keeps all of them ▸ Label size HUD ▸ Show HUD · Position: bottom centre (default), top centre, bottom right or top right · text size Alerts ▸ QM formed (BOS) · QML tapped · Target hit / failed Visuals ▸ Neon candles — electric blue rising, neon red falling; the pattern structure and targets in white. Off = your own chart candles. ▸ Glow candles — each body brightens towards the close. Off = flat neon bodies.
❻ ALERTS ▸ QM formed — with the QML and the head ▸ QML tapped — with T1, T2 and the invalidation level ▸ Target hit, pattern failed Create the alert with "Any alert() function call" for the full messages, or use the four alert conditions.
❼ NON-REPAINTING Swings are confirmed pivots, so a shoulder or a head is known "swing strength" bars after it forms — the pattern is never drawn before its parts exist. The BOS, the QML tap, target hits and failures are decided on closed bars, and no drawing is moved back in time. The script does not use request.security or lookahead.
LIMITATIONS ▸ Swing confirmation delays the pattern: the BOS can only be registered once the head is a confirmed swing. In a fast move the BOS label can appear a few bars after price first crossed the level. ▸ The quasimodo is read from three alternating swings with fixed rules (sweep size, close through the middle swing). Other traders draw the same pattern by eye and may disagree on some of them. ▸ One pattern is tracked at a time; a QM that forms while another is running is not tracked. ▸ The track record covers only the history loaded on your chart, and the "QML reached" share also counts patterns that are still waiting. Small samples are noisy — check how many QMs formed before trusting a percentage. Past rates are not a forecast. ▸ The pattern gives a structure, a level and targets — not an entry. It has no stop loss or position sizing; combine it with your own entry rules and risk management.
This script is for educational purposes only and is not financial advice. Trading involves risk.

Trade setups with clear entry, stop, target and risk logic. Built for traders who want structure, not guessing.
💬 t.me/lunqfx
🌐 lunqfx.com/premium
💬 t.me/lunqfx
🌐 lunqfx.com/premium
免責聲明
這些資訊和出版物並非旨在提供,也不構成TradingView提供或認可的任何形式的財務、投資、交易或其他類型的建議或推薦。請閱讀使用條款以了解更多資訊。
Trade setups with clear entry, stop, target and risk logic. Built for traders who want structure, not guessing.
💬 t.me/lunqfx
🌐 lunqfx.com/premium
💬 t.me/lunqfx
🌐 lunqfx.com/premium
免責聲明
這些資訊和出版物並非旨在提供,也不構成TradingView提供或認可的任何形式的財務、投資、交易或其他類型的建議或推薦。請閱讀使用條款以了解更多資訊。