OPEN-SOURCE SCRIPT
Multi-TF Volume Delta & RSI Table
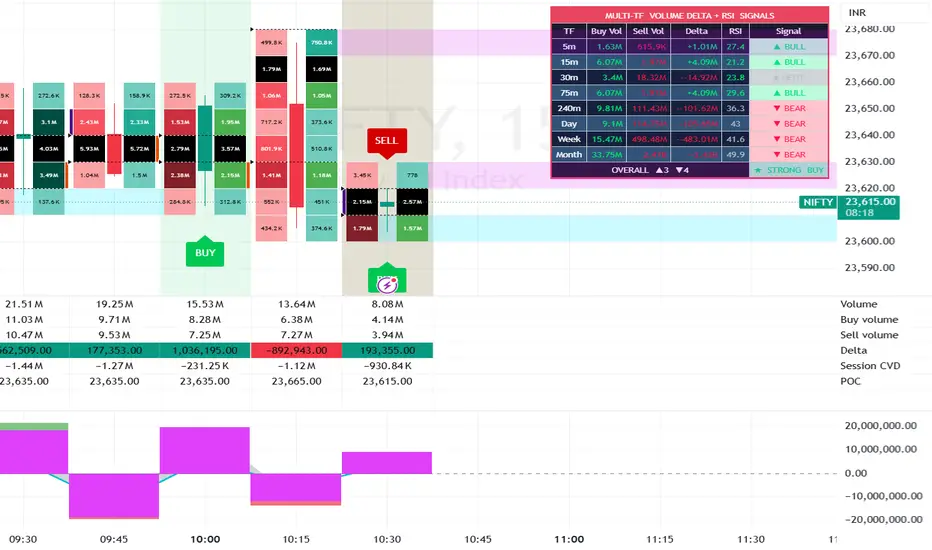
Here's a technical description for your MTF Volume Delta indicator:
Multi-Timeframe Volume Delta
This indicator displays Volume Delta — the difference between buying and selling volume — across multiple user-defined timeframes, giving traders a deeper view of market aggression and order flow that a single timeframe cannot provide.
How It Works
Volume Delta is calculated by separating volume into buy-side (up-close candles) and sell-side (down-close candles) components, then computing the net difference (Buy Volume − Sell Volume) for each bar. By pulling this data from higher timeframes and overlaying it on your current chart, the indicator reveals whether bulls or bears are in control at a macro level — context that is often invisible on lower timeframe charts alone.
Key Features
Multi-Timeframe Support — Analyze volume delta from customizable higher timeframes without leaving your current chart view
Cross-Timeframe Confluence — Identify when buying or selling pressure aligns across multiple timeframes, a strong signal of directional conviction
Non-Repainting Design — Higher timeframe values are pulled from confirmed, closed candles to ensure historical accuracy and reliable backtesting
Use Cases
Confirm breakouts by checking whether volume delta on a higher timeframe supports the move
Spot divergences where price makes new highs/lows but delta weakens — a leading indicator of reversals
Filter low-conviction setups by requiring delta alignment across timeframes before entering a trade
Recommended For
Intraday and swing traders who incorporate order flow analysis into their decision-making and want timeframe confluence built directly into their workflow.
Multi-Timeframe Volume Delta
This indicator displays Volume Delta — the difference between buying and selling volume — across multiple user-defined timeframes, giving traders a deeper view of market aggression and order flow that a single timeframe cannot provide.
How It Works
Volume Delta is calculated by separating volume into buy-side (up-close candles) and sell-side (down-close candles) components, then computing the net difference (Buy Volume − Sell Volume) for each bar. By pulling this data from higher timeframes and overlaying it on your current chart, the indicator reveals whether bulls or bears are in control at a macro level — context that is often invisible on lower timeframe charts alone.
Key Features
Multi-Timeframe Support — Analyze volume delta from customizable higher timeframes without leaving your current chart view
Cross-Timeframe Confluence — Identify when buying or selling pressure aligns across multiple timeframes, a strong signal of directional conviction
Non-Repainting Design — Higher timeframe values are pulled from confirmed, closed candles to ensure historical accuracy and reliable backtesting
Use Cases
Confirm breakouts by checking whether volume delta on a higher timeframe supports the move
Spot divergences where price makes new highs/lows but delta weakens — a leading indicator of reversals
Filter low-conviction setups by requiring delta alignment across timeframes before entering a trade
Recommended For
Intraday and swing traders who incorporate order flow analysis into their decision-making and want timeframe confluence built directly into their workflow.
開源腳本
秉持TradingView一貫精神,這個腳本的創作者將其設為開源,以便交易者檢視並驗證其功能。向作者致敬!您可以免費使用此腳本,但請注意,重新發佈代碼需遵守我們的社群規範。

rstorage75@gmail.com
免責聲明
這些資訊和出版物並非旨在提供,也不構成TradingView提供或認可的任何形式的財務、投資、交易或其他類型的建議或推薦。請閱讀使用條款以了解更多資訊。
開源腳本
秉持TradingView一貫精神,這個腳本的創作者將其設為開源,以便交易者檢視並驗證其功能。向作者致敬!您可以免費使用此腳本,但請注意,重新發佈代碼需遵守我們的社群規範。
rstorage75@gmail.com
免責聲明
這些資訊和出版物並非旨在提供,也不構成TradingView提供或認可的任何形式的財務、投資、交易或其他類型的建議或推薦。請閱讀使用條款以了解更多資訊。