Low Since DateTime * X Level
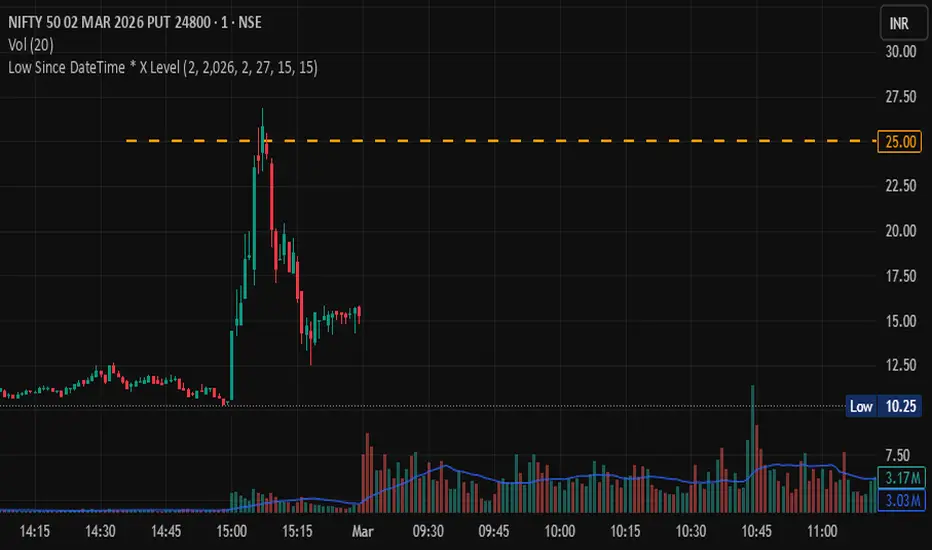
Low Since DateTime × X LevelThis indicator tracks the lowest price from a user-defined DateTime up to the current bar and plots a dynamic horizontal level at that low multiplied by a custom factor X.How it works:
You define an exact start DateTime (date + time) as the reference point
The indicator scans every bar from that DateTime to the present and finds the absolute lowest low
Multiplies that low by X to compute the target level
Draws a dashed horizontal line at that level extending across the chart
Displays a label with the full formula and exact computed price
Pins the price value on the right-side price axis for instant reference
Use Cases:
Track key levels relative to session lows, event lows, or specific market structure points
Useful for options traders monitoring premium levels relative to a reference low
Identify dynamic support/resistance as a multiple of a significant low
Works on any timeframe — intraday, daily, weekly
You define an exact start DateTime (date + time) as the reference point
The indicator scans every bar from that DateTime to the present and finds the absolute lowest low
Multiplies that low by X to compute the target level
Draws a dashed horizontal line at that level extending across the chart
Displays a label with the full formula and exact computed price
Pins the price value on the right-side price axis for instant reference
Use Cases:
Track key levels relative to session lows, event lows, or specific market structure points
Useful for options traders monitoring premium levels relative to a reference low
Identify dynamic support/resistance as a multiple of a significant low
Works on any timeframe — intraday, daily, weekly

免責聲明
這些資訊和出版物並非旨在提供,也不構成TradingView提供或認可的任何形式的財務、投資、交易或其他類型的建議或推薦。請閱讀使用條款以了解更多資訊。