Quant Macro Strategy Indicator Alpha
OVERVIEW
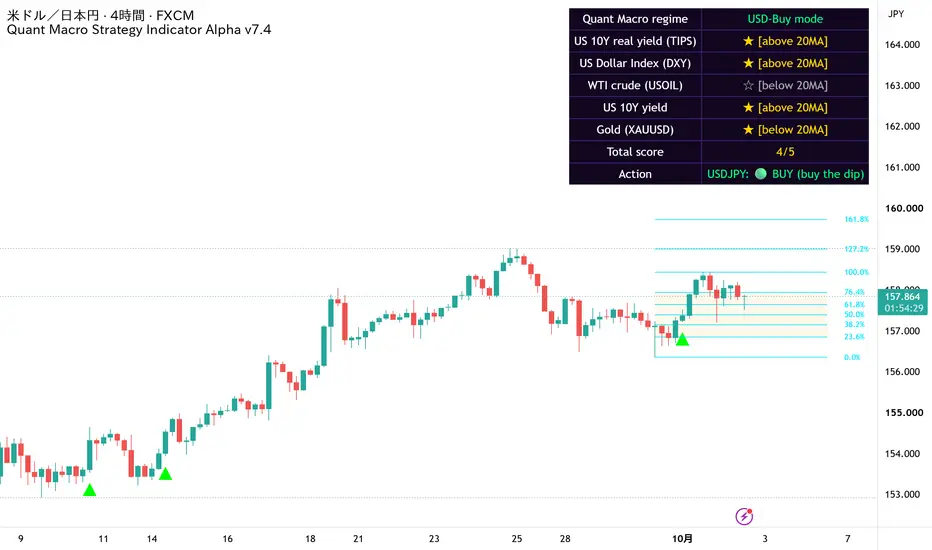
Quant Macro Strategy Indicator Alpha is a chart overlay that combines three things in one script: a daily macro regime filter built from five US-dollar-related markets, a 20 EMA crossover signal that is only shown when it agrees with that regime, and an automatically drawn Fibonacci grid oriented in the same direction.
The aim is not to predict price. It is to stop three common mistakes: trading against the broader macro direction, taking a good-looking setup that runs against that direction, and entering without a predefined target and risk.
HOW THE MACRO REGIME IS CALCULATED
The script requests the daily close and the daily 20-period SMA of five instruments, regardless of the chart's timeframe:
1. US 10-year real yield (FRED:DFII10) - counted when above its daily 20 SMA
2. US Dollar Index (TVC:DXY) - counted when above its daily 20 SMA
3. WTI crude oil (TVC:USOIL) - counted when above its daily 20 SMA
4. US 10-year Treasury yield (TVC:US10Y) - counted when above its daily 20 SMA
5. Gold (OANDA:XAUUSD) - counted when BELOW its daily 20 SMA
Each condition adds one point. A score of 3 or more out of 5 sets "USD-Buy mode"; 2 or less sets "Equity-Buy mode".
Why these five, and why gold is inverted: real yields, nominal yields and the dollar index tend to rise together when US dollar demand is strong, while gold has historically moved against the dollar. Crude oil is treated as moving with the dollar because the United States has become a net oil exporter; this relationship is less stable than the others and can change, so it is one vote out of five rather than a deciding factor.
Because the regime is always computed from daily data, every timeframe and every chart pane shows the same regime at the same time.
HOW THE SCRIPT APPLIES THE REGIME TO YOUR SYMBOL
The script classifies the chart symbol by its ticker and currency:
- Moves WITH the dollar: US Treasury yields (2Y-30Y), the dollar index, crude oil, USD-base FX pairs (e.g. USDJPY, USDCHF), and JPY crosses (e.g. EURJPY, AUDJPY - treated like USDJPY because yen strength or weakness usually dominates these pairs).
- Moves AGAINST the dollar: major equity indices (Nikkei 225, Nasdaq 100, S&P 500, Dow, DAX, FTSE), gold and silver, and EUR/GBP/AUD/NZD-base FX pairs.
In USD-Buy mode the first group is marked BUY and the second SELL. In Equity-Buy mode the directions are reversed. Equity indices and metals quoted in USD are deliberately kept in the second group so that a broker's quote currency does not flip their direction.
Symbols that match neither group (for example other crosses, crypto or other commodities) are marked "Unclassified" and, by default, treated like equity indices. Enabling "Do not judge unclassified symbols" shows NO TRADE for them and suppresses their signals instead.
ENTRY SIGNALS
A triangle is plotted when price crosses the 20 EMA of the chart timeframe, but only in the direction allowed by the macro regime: upward crosses when the symbol is marked BUY, downward crosses when it is marked SELL. Crosses in the opposite direction are ignored by design. By default a signal is confirmed only when the chart bar closes. Alerts are available for both signals.
AUTOMATIC FIBONACCI
The script finds the most recent swing high and swing low (a bar higher or lower than the 5 bars on each side, by default) and draws a Fibonacci grid between them. The grid is anchored at the swing low when the bias is BUY and at the swing high when the bias is SELL, so the extension levels (127.2%, 161.8%, 261.8%, 423.6%) always point in the trade direction. The 23.6%-76.4% zone is shaded as a consolidation area. Every level, including the negative extensions, can be switched on or off.
DASHBOARD
A panel shows the current mode, the score out of 5, and the action for the chart symbol. The Full view also lists the state of each of the five markets. Three sizes and three layouts are available.
HOW TO USE
1. Check the mode and the action for your symbol on the dashboard.
2. Wait for price to pull back into the 23.6%-76.4% zone of the Fibonacci grid, or for a 20 EMA cross in the allowed direction.
3. Place the stop beyond the swing point that anchors the grid, and use the extension levels as reference targets. Knowing the stop and target before entry lets you check the risk-reward ratio first.
The script is designed for swing trading on the 4-hour to daily timeframes, with positions held for days to weeks.
WHY THIS SCRIPT IS CLOSED SOURCE
Moving averages, EMA crossovers and Fibonacci retracements are standard tools. What this script adds is the specific selection and direction of the five macro inputs, the symbol classification that maps the regime to BUY or SELL for each market, and the coupling of the signal filter and Fibonacci orientation to that result. The direction of each input was checked against about ten years of daily data (2016-2026) using correlation analysis. These rules form the part that is not shown in the source.
LIMITATIONS AND IMPORTANT BEHAVIOR
- Repainting of the regime (default setting): by default the regime uses the current, still-forming daily bar, so the mode can change during the trading day and earlier readings on intraday charts can change. Enable "5 macro factors: use previous day's close" to use the previous day's confirmed values instead; the mode then changes at most once per day, but one day later.
- Signals on bar close: by default ("Arrows (20 EMA cross): show after the chart bar closes" = ON), arrows and alerts appear only after the chart bar has closed, so they do not appear and disappear within a bar. If this option is turned OFF, arrows are evaluated in real time and can disappear before the bar closes.
- Swing selection: a high or low within the most recent 5 bars (the "Swing high/low: bars to the right" setting) cannot be used yet, because the bars after it have not formed. The grid therefore starts from the most recent swing that has at least that many bars after it.
- The score uses only the position of each market relative to its daily 20 SMA. It does not consider weekly or monthly trends, the 200-period moving average, or news events.
- Inter-market relationships change over time. In periods when interest rates are not the main driver of markets, the premise of this script weakens.
- The design accepts more losing trades than winning trades in exchange for larger wins than losses. It is not a high win-rate tool and it is not an automated trading system. All trading decisions remain the user's responsibility.
- Symbol classification is based on ticker text. Unusual broker tickers may be misclassified; check the dashboard's action for your symbol.
Data sources: FRED:DFII10, TVC:DXY, TVC:USOIL, TVC:US10Y, OANDA:XAUUSD (all requested on the daily timeframe with lookahead off).
Settings language: the interface is in English, with Japanese shown alongside. A "Language" setting switches the dashboard text between English and Japanese.
---
[Japanese / 日本語]
クオンツマクロ戦略インジケーター Alpha は、米ドルに関連する5つの市場(米10年実質金利・米ドル指数・WTI原油・米10年債利回り・金)が日足20SMAの上下どちらにあるかを集計し、「ドル買いモード」か「株買いモード」かを判定します。判定に沿った方向の20EMAクロスだけをシグナルとして表示し、同じ方向にフィボナッチを自動で描画します。
初期設定では形成中の日足で判定するため、日中にモードが変わることがあります(「マクロ5因子:前日の確定値で判定」をONにすると、前日の確定値で判定します)。シグナルは初期設定で足の確定後にのみ表示されます。勝率の高さを目的とした道具ではなく、売買判断はご自身の責任で行ってください。
Quant Macro Strategy Indicator Alpha is a chart overlay that combines three things in one script: a daily macro regime filter built from five US-dollar-related markets, a 20 EMA crossover signal that is only shown when it agrees with that regime, and an automatically drawn Fibonacci grid oriented in the same direction.
The aim is not to predict price. It is to stop three common mistakes: trading against the broader macro direction, taking a good-looking setup that runs against that direction, and entering without a predefined target and risk.
HOW THE MACRO REGIME IS CALCULATED
The script requests the daily close and the daily 20-period SMA of five instruments, regardless of the chart's timeframe:
1. US 10-year real yield (FRED:DFII10) - counted when above its daily 20 SMA
2. US Dollar Index (TVC:DXY) - counted when above its daily 20 SMA
3. WTI crude oil (TVC:USOIL) - counted when above its daily 20 SMA
4. US 10-year Treasury yield (TVC:US10Y) - counted when above its daily 20 SMA
5. Gold (OANDA:XAUUSD) - counted when BELOW its daily 20 SMA
Each condition adds one point. A score of 3 or more out of 5 sets "USD-Buy mode"; 2 or less sets "Equity-Buy mode".
Why these five, and why gold is inverted: real yields, nominal yields and the dollar index tend to rise together when US dollar demand is strong, while gold has historically moved against the dollar. Crude oil is treated as moving with the dollar because the United States has become a net oil exporter; this relationship is less stable than the others and can change, so it is one vote out of five rather than a deciding factor.
Because the regime is always computed from daily data, every timeframe and every chart pane shows the same regime at the same time.
HOW THE SCRIPT APPLIES THE REGIME TO YOUR SYMBOL
The script classifies the chart symbol by its ticker and currency:
- Moves WITH the dollar: US Treasury yields (2Y-30Y), the dollar index, crude oil, USD-base FX pairs (e.g. USDJPY, USDCHF), and JPY crosses (e.g. EURJPY, AUDJPY - treated like USDJPY because yen strength or weakness usually dominates these pairs).
- Moves AGAINST the dollar: major equity indices (Nikkei 225, Nasdaq 100, S&P 500, Dow, DAX, FTSE), gold and silver, and EUR/GBP/AUD/NZD-base FX pairs.
In USD-Buy mode the first group is marked BUY and the second SELL. In Equity-Buy mode the directions are reversed. Equity indices and metals quoted in USD are deliberately kept in the second group so that a broker's quote currency does not flip their direction.
Symbols that match neither group (for example other crosses, crypto or other commodities) are marked "Unclassified" and, by default, treated like equity indices. Enabling "Do not judge unclassified symbols" shows NO TRADE for them and suppresses their signals instead.
ENTRY SIGNALS
A triangle is plotted when price crosses the 20 EMA of the chart timeframe, but only in the direction allowed by the macro regime: upward crosses when the symbol is marked BUY, downward crosses when it is marked SELL. Crosses in the opposite direction are ignored by design. By default a signal is confirmed only when the chart bar closes. Alerts are available for both signals.
AUTOMATIC FIBONACCI
The script finds the most recent swing high and swing low (a bar higher or lower than the 5 bars on each side, by default) and draws a Fibonacci grid between them. The grid is anchored at the swing low when the bias is BUY and at the swing high when the bias is SELL, so the extension levels (127.2%, 161.8%, 261.8%, 423.6%) always point in the trade direction. The 23.6%-76.4% zone is shaded as a consolidation area. Every level, including the negative extensions, can be switched on or off.
DASHBOARD
A panel shows the current mode, the score out of 5, and the action for the chart symbol. The Full view also lists the state of each of the five markets. Three sizes and three layouts are available.
HOW TO USE
1. Check the mode and the action for your symbol on the dashboard.
2. Wait for price to pull back into the 23.6%-76.4% zone of the Fibonacci grid, or for a 20 EMA cross in the allowed direction.
3. Place the stop beyond the swing point that anchors the grid, and use the extension levels as reference targets. Knowing the stop and target before entry lets you check the risk-reward ratio first.
The script is designed for swing trading on the 4-hour to daily timeframes, with positions held for days to weeks.
WHY THIS SCRIPT IS CLOSED SOURCE
Moving averages, EMA crossovers and Fibonacci retracements are standard tools. What this script adds is the specific selection and direction of the five macro inputs, the symbol classification that maps the regime to BUY or SELL for each market, and the coupling of the signal filter and Fibonacci orientation to that result. The direction of each input was checked against about ten years of daily data (2016-2026) using correlation analysis. These rules form the part that is not shown in the source.
LIMITATIONS AND IMPORTANT BEHAVIOR
- Repainting of the regime (default setting): by default the regime uses the current, still-forming daily bar, so the mode can change during the trading day and earlier readings on intraday charts can change. Enable "5 macro factors: use previous day's close" to use the previous day's confirmed values instead; the mode then changes at most once per day, but one day later.
- Signals on bar close: by default ("Arrows (20 EMA cross): show after the chart bar closes" = ON), arrows and alerts appear only after the chart bar has closed, so they do not appear and disappear within a bar. If this option is turned OFF, arrows are evaluated in real time and can disappear before the bar closes.
- Swing selection: a high or low within the most recent 5 bars (the "Swing high/low: bars to the right" setting) cannot be used yet, because the bars after it have not formed. The grid therefore starts from the most recent swing that has at least that many bars after it.
- The score uses only the position of each market relative to its daily 20 SMA. It does not consider weekly or monthly trends, the 200-period moving average, or news events.
- Inter-market relationships change over time. In periods when interest rates are not the main driver of markets, the premise of this script weakens.
- The design accepts more losing trades than winning trades in exchange for larger wins than losses. It is not a high win-rate tool and it is not an automated trading system. All trading decisions remain the user's responsibility.
- Symbol classification is based on ticker text. Unusual broker tickers may be misclassified; check the dashboard's action for your symbol.
Data sources: FRED:DFII10, TVC:DXY, TVC:USOIL, TVC:US10Y, OANDA:XAUUSD (all requested on the daily timeframe with lookahead off).
Settings language: the interface is in English, with Japanese shown alongside. A "Language" setting switches the dashboard text between English and Japanese.
---
[Japanese / 日本語]
クオンツマクロ戦略インジケーター Alpha は、米ドルに関連する5つの市場(米10年実質金利・米ドル指数・WTI原油・米10年債利回り・金)が日足20SMAの上下どちらにあるかを集計し、「ドル買いモード」か「株買いモード」かを判定します。判定に沿った方向の20EMAクロスだけをシグナルとして表示し、同じ方向にフィボナッチを自動で描画します。
初期設定では形成中の日足で判定するため、日中にモードが変わることがあります(「マクロ5因子:前日の確定値で判定」をONにすると、前日の確定値で判定します)。シグナルは初期設定で足の確定後にのみ表示されます。勝率の高さを目的とした道具ではなく、売買判断はご自身の責任で行ってください。

フィボナッチトレーディング専門 スリースタータードットジェーピー
3starter.jp
Fibonacci trading education
^^^^^^^^^^^^^
▶ ライントレーダーズ通信と分析手法の紹介、招待専用インジケーターの申請はこちら
3starter.jp/tradingview
※ Apply for invite-only indicators, or DM me via my profile icon.
3starter.jp
Fibonacci trading education
^^^^^^^^^^^^^
▶ ライントレーダーズ通信と分析手法の紹介、招待専用インジケーターの申請はこちら
3starter.jp/tradingview
※ Apply for invite-only indicators, or DM me via my profile icon.
免責聲明
這些資訊和出版物並非旨在提供,也不構成TradingView提供或認可的任何形式的財務、投資、交易或其他類型的建議或推薦。請閱讀使用條款以了解更多資訊。
フィボナッチトレーディング専門 スリースタータードットジェーピー
3starter.jp
Fibonacci trading education
^^^^^^^^^^^^^
▶ ライントレーダーズ通信と分析手法の紹介、招待専用インジケーターの申請はこちら
3starter.jp/tradingview
※ Apply for invite-only indicators, or DM me via my profile icon.
3starter.jp
Fibonacci trading education
^^^^^^^^^^^^^
▶ ライントレーダーズ通信と分析手法の紹介、招待専用インジケーターの申請はこちら
3starter.jp/tradingview
※ Apply for invite-only indicators, or DM me via my profile icon.
免責聲明
這些資訊和出版物並非旨在提供,也不構成TradingView提供或認可的任何形式的財務、投資、交易或其他類型的建議或推薦。請閱讀使用條款以了解更多資訊。