OPEN-SOURCE SCRIPT
Time Pattern Analyzer - Multi Mode [fmb]
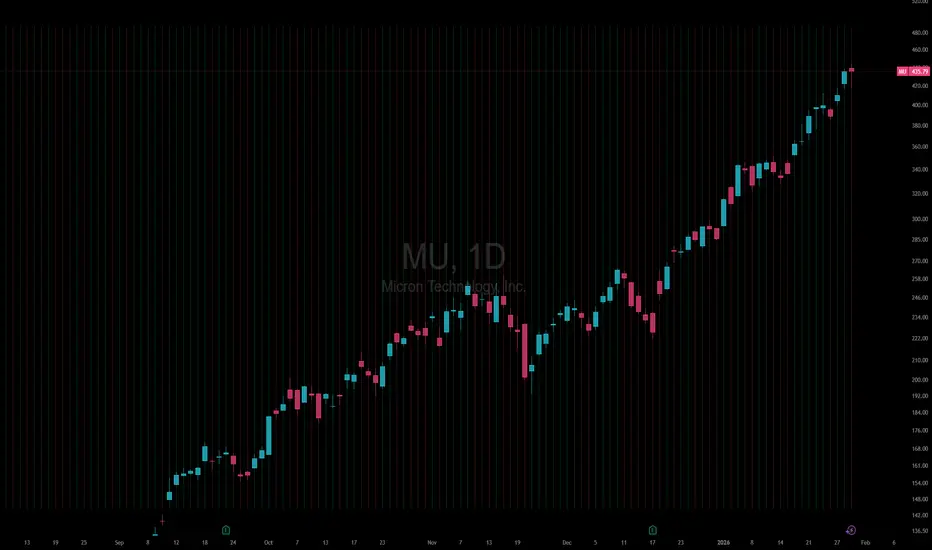
This is a lightweight session-behaviour overlay that helps you spot whether a market tends to move up or down at specific days or times.
- Two analysis modes
Weekday: Breaks performance down by Mon–Fri
Hour of Day: Breaks performance down by 0–23 and can also track a single exact time (hour + minute), like 09:30
- Visual timing markers (optional)
Draws vertical lines on the chart for the selected day(s) or time(s)
Line colour reflects the bar direction: green (up), red (down), grey (neutral)
Fully adjustable width and style (solid, dotted, dashed)
- Flexible “green vs red” definition
Body mode: Close > Open (candle body direction)
Previous close mode: Close > Close[1] (momentum vs prior bar)
- Stats table (optional)
For each day or hour, the table shows:
Count (sample size)
% Green
% Red
Average % move (average return for that bucket)
Table can be positioned anywhere on the chart (top/bottom, left/centre/right)
Use cases
- Quickly identify recurring tendencies like “Mondays are strongest” or “first hour is choppy,” and validate timing ideas with clear counts and averages instead of guesswork.
Note: This tool reports historical tendencies, not predictions. Always account for regime changes, news risk, and liquidity.
- Two analysis modes
Weekday: Breaks performance down by Mon–Fri
Hour of Day: Breaks performance down by 0–23 and can also track a single exact time (hour + minute), like 09:30
- Visual timing markers (optional)
Draws vertical lines on the chart for the selected day(s) or time(s)
Line colour reflects the bar direction: green (up), red (down), grey (neutral)
Fully adjustable width and style (solid, dotted, dashed)
- Flexible “green vs red” definition
Body mode: Close > Open (candle body direction)
Previous close mode: Close > Close[1] (momentum vs prior bar)
- Stats table (optional)
For each day or hour, the table shows:
Count (sample size)
% Green
% Red
Average % move (average return for that bucket)
Table can be positioned anywhere on the chart (top/bottom, left/centre/right)
Use cases
- Quickly identify recurring tendencies like “Mondays are strongest” or “first hour is choppy,” and validate timing ideas with clear counts and averages instead of guesswork.
Note: This tool reports historical tendencies, not predictions. Always account for regime changes, news risk, and liquidity.
開源腳本
秉持TradingView一貫精神,這個腳本的創作者將其設為開源,以便交易者檢視並驗證其功能。向作者致敬!您可以免費使用此腳本,但請注意,重新發佈代碼需遵守我們的社群規範。

免責聲明
這些資訊和出版物並非旨在提供,也不構成TradingView提供或認可的任何形式的財務、投資、交易或其他類型的建議或推薦。請閱讀使用條款以了解更多資訊。
開源腳本
秉持TradingView一貫精神,這個腳本的創作者將其設為開源,以便交易者檢視並驗證其功能。向作者致敬!您可以免費使用此腳本,但請注意,重新發佈代碼需遵守我們的社群規範。
免責聲明
這些資訊和出版物並非旨在提供,也不構成TradingView提供或認可的任何形式的財務、投資、交易或其他類型的建議或推薦。請閱讀使用條款以了解更多資訊。