OPEN-SOURCE SCRIPT
MNQ Liquidity Model v2 [Clean]
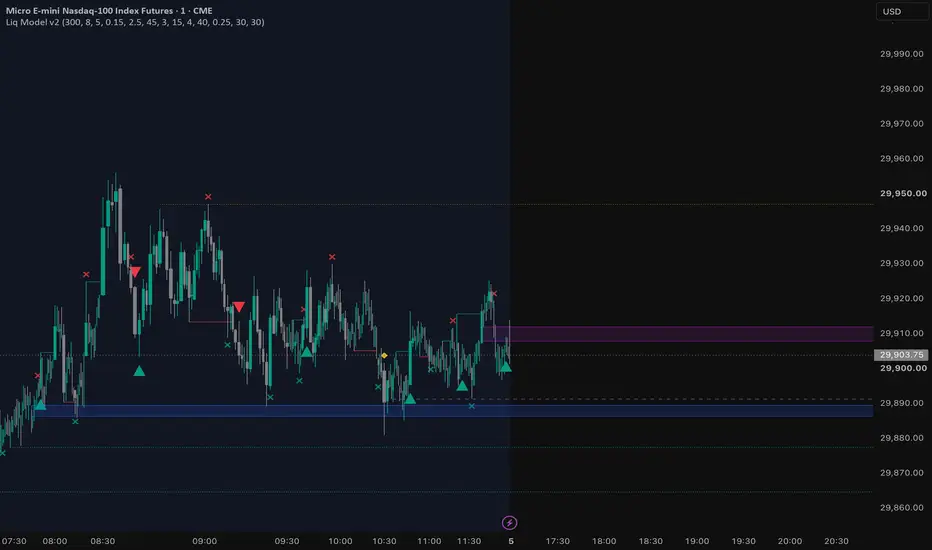
The setup you’re waiting for (in order):
1. Price runs a liquidity level — PDH/PDL, equal highs/lows (dotted lines), or a swing point. You’ll see a small x-cross when it sweeps: price pokes through the level but closes back inside. That’s the trap.
2. BOS confirms the reversal — within ~30 bars, price closes through the last swing in the opposite direction. Thin red/teal line appears. Now the model is “armed.”
3. Entry on the IFVG retest — the displacement move that broke structure will have blown through an old FVG, flipping it into a purple zone (short) or blue zone (long). When price pulls back into that zone and closes rejected off it → triangle prints. That’s your entry.
1. Price runs a liquidity level — PDH/PDL, equal highs/lows (dotted lines), or a swing point. You’ll see a small x-cross when it sweeps: price pokes through the level but closes back inside. That’s the trap.
2. BOS confirms the reversal — within ~30 bars, price closes through the last swing in the opposite direction. Thin red/teal line appears. Now the model is “armed.”
3. Entry on the IFVG retest — the displacement move that broke structure will have blown through an old FVG, flipping it into a purple zone (short) or blue zone (long). When price pulls back into that zone and closes rejected off it → triangle prints. That’s your entry.
開源腳本
秉持TradingView一貫精神,這個腳本的創作者將其設為開源,以便交易者檢視並驗證其功能。向作者致敬!您可以免費使用此腳本,但請注意,重新發佈代碼需遵守我們的社群規範。

免責聲明
這些資訊和出版物並非旨在提供,也不構成TradingView提供或認可的任何形式的財務、投資、交易或其他類型的建議或推薦。請閱讀使用條款以了解更多資訊。
開源腳本
秉持TradingView一貫精神,這個腳本的創作者將其設為開源,以便交易者檢視並驗證其功能。向作者致敬!您可以免費使用此腳本,但請注意,重新發佈代碼需遵守我們的社群規範。
免責聲明
這些資訊和出版物並非旨在提供,也不構成TradingView提供或認可的任何形式的財務、投資、交易或其他類型的建議或推薦。請閱讀使用條款以了解更多資訊。