OPEN-SOURCE SCRIPT
Peer-Relative Breakdown Strategy
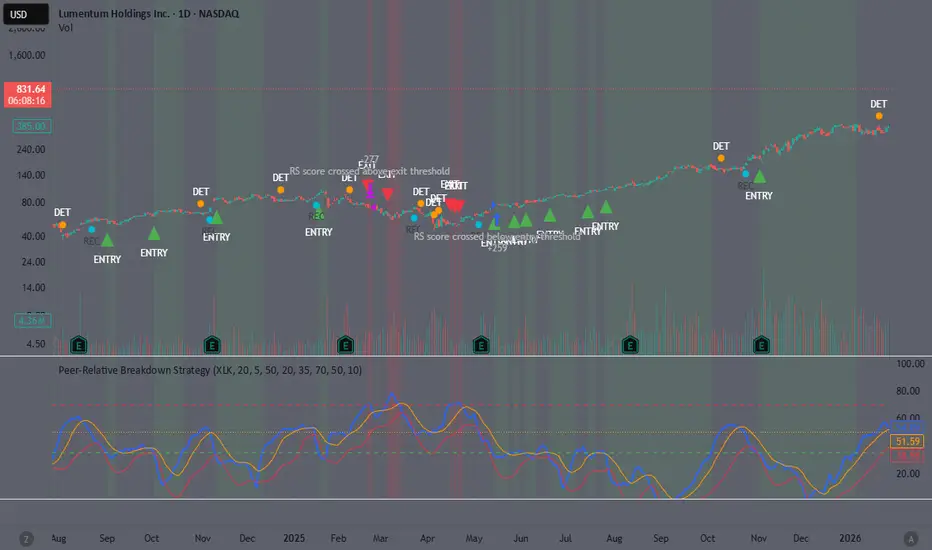
he intuition (what’s actually happening)
Think about how capital flows work.
When institutions start losing conviction in a name, they usually don’t immediately dump it outright. What happens first is:
they rotate within the sector
they shift into stronger peers
they reduce marginal buying
So the stock:
may still go up
but it goes up less than its peers
That is the earliest detectable signal of deterioration.
This model is built specifically to isolate that.
What the math is doing (in plain terms)
Step 1: Strip out the sector move
You compute:
Relative Spread
=
Stock Return
−
ETF Return
Relative Spread=Stock Return−ETF Return
So if:
stock = +4%
ETF = +10%
Then:
Spread
=
−
6
%
Spread=−6%
That tells you:
“Even though the stock is up, it is underperforming its peers materially.”
This removes:
market direction
sector beta
macro noise
What remains is:
pure relative performance
Step 2: Normalize by volatility
Not all -6% moves are equal.
If a stock normally moves ±10%, that’s nothing.
If it normally moves ±2%, that’s huge.
So you standardize:
𝑍
=
Spread
Volatility of Spread
Z=
Volatility of Spread
Spread
Now you are measuring:
“How unusual is this underperformance relative to its own history?”
This is the key step.
Because now:
you’re not just detecting weakness
you’re detecting statistically meaningful weakness
Step 3: Convert to a usable score
You transform that into a bounded score:
𝑆
𝑐
𝑜
𝑟
𝑒
=
50
−
(
𝑍
×
𝑠
𝑐
𝑎
𝑙
𝑒
)
Score=50−(Z×scale)
So:
Score ~50 → normal behavior
Score rising above 50 → increasing underperformance
Score >70 → significant deterioration
Score <35 → strong relative performance
This makes it interpretable and consistent across stocks.
Step 4: Smooth it
You apply an EMA:
𝑆
𝑐
𝑜
𝑟
𝑒
𝑠
𝑚
𝑜
𝑜
𝑡
ℎ
=
𝐸
𝑀
𝐴
(
𝑆
𝑐
𝑜
𝑟
𝑒
)
Score
smooth
=EMA(Score)
This is critical.
Without smoothing:
you get noise
you get false signals
With smoothing:
you turn short-term fluctuations into persistent signals of change
Step 5: Add a trend filter
You only act when:
𝑃
𝑟
𝑖
𝑐
𝑒
>
𝐸
𝑀
𝐴
(
50
)
Price>EMA(50)
Why?
Because:
relative improvement inside a downtrend is often meaningless
you want confirmation that absolute demand has returned
Why this helps detect deterioration early
Because deterioration typically unfolds like this:
Phase 1 (early)
stock lags peers
still looks fine on its own chart
your score starts rising
Phase 2 (mid)
score moves above 50 → then 60+
relative weakness becomes persistent
institutions are rotating away
Phase 3 (late)
price breaks down
everyone sees it
edge is gone
This model is designed to catch Phase 1 → Phase 2 transition.
How to interpret it in practice
1. Healthy / Strong (<35–40)
stock outperforming peers
capital flowing in
safe to hold / add
2. Neutral / Watch (40–60)
early drift vs peers
not actionable yet
but something to monitor
3. Deteriorating (60–70)
consistent underperformance
early institutional rotation away
this is where you:
stop adding
start trimming
4. Breakdown (>70)
statistically meaningful weakness
likely tied to:
earnings revisions
positioning unwind
fundamental shift
This is your exit zone.
When to get out (this is the key part)
The model gives you a structured way to exit without guessing.
Primary exit signal
Score crosses above 70
Score crosses above 70
Interpretation:
“This is no longer noise. This is a real breakdown relative to peers.”
That is your hard exit.
Earlier risk management (before full exit)
You don’t need to wait for 70.
You can manage risk like this:
50–60 → stop adding
60+ → trim
70+ → exit
That creates a graduated response, not all-or-nothing.
Re-entry logic
You don’t just buy when price goes up.
You require:
Score crosses below 35 AND price > trend
Score crosses below 35 AND price > trend
That means:
relative strength has returned
and absolute trend confirms it
So you are buying:
stocks that are re-accelerating vs peers, not just bouncing
Why this works (when it does)
Because it captures something most indicators don’t:
relative capital allocation shifts
Price indicators:
tell you what already happened
This:
tells you where money is going (or leaving)
That’s earlier, and often more actionable.
Where it can fail
It’s important to be honest here.
This will struggle when:
1. Sector is very strong
stock lags slightly
score rises
but stock still performs fine
2. Sector definition is imperfect
ETF doesn’t match true peer set
signal becomes noisy
3. Sideways markets
relative performance oscillates
creates false signals
The correct way to use it
This is not a standalone “buy/sell system.”
It is best used as:
a position management tool
a relative strength filter
a way to identify:
hidden weakness
early deterioration
laggards in strong sectors
Think about how capital flows work.
When institutions start losing conviction in a name, they usually don’t immediately dump it outright. What happens first is:
they rotate within the sector
they shift into stronger peers
they reduce marginal buying
So the stock:
may still go up
but it goes up less than its peers
That is the earliest detectable signal of deterioration.
This model is built specifically to isolate that.
What the math is doing (in plain terms)
Step 1: Strip out the sector move
You compute:
Relative Spread
=
Stock Return
−
ETF Return
Relative Spread=Stock Return−ETF Return
So if:
stock = +4%
ETF = +10%
Then:
Spread
=
−
6
%
Spread=−6%
That tells you:
“Even though the stock is up, it is underperforming its peers materially.”
This removes:
market direction
sector beta
macro noise
What remains is:
pure relative performance
Step 2: Normalize by volatility
Not all -6% moves are equal.
If a stock normally moves ±10%, that’s nothing.
If it normally moves ±2%, that’s huge.
So you standardize:
𝑍
=
Spread
Volatility of Spread
Z=
Volatility of Spread
Spread
Now you are measuring:
“How unusual is this underperformance relative to its own history?”
This is the key step.
Because now:
you’re not just detecting weakness
you’re detecting statistically meaningful weakness
Step 3: Convert to a usable score
You transform that into a bounded score:
𝑆
𝑐
𝑜
𝑟
𝑒
=
50
−
(
𝑍
×
𝑠
𝑐
𝑎
𝑙
𝑒
)
Score=50−(Z×scale)
So:
Score ~50 → normal behavior
Score rising above 50 → increasing underperformance
Score >70 → significant deterioration
Score <35 → strong relative performance
This makes it interpretable and consistent across stocks.
Step 4: Smooth it
You apply an EMA:
𝑆
𝑐
𝑜
𝑟
𝑒
𝑠
𝑚
𝑜
𝑜
𝑡
ℎ
=
𝐸
𝑀
𝐴
(
𝑆
𝑐
𝑜
𝑟
𝑒
)
Score
smooth
=EMA(Score)
This is critical.
Without smoothing:
you get noise
you get false signals
With smoothing:
you turn short-term fluctuations into persistent signals of change
Step 5: Add a trend filter
You only act when:
𝑃
𝑟
𝑖
𝑐
𝑒
>
𝐸
𝑀
𝐴
(
50
)
Price>EMA(50)
Why?
Because:
relative improvement inside a downtrend is often meaningless
you want confirmation that absolute demand has returned
Why this helps detect deterioration early
Because deterioration typically unfolds like this:
Phase 1 (early)
stock lags peers
still looks fine on its own chart
your score starts rising
Phase 2 (mid)
score moves above 50 → then 60+
relative weakness becomes persistent
institutions are rotating away
Phase 3 (late)
price breaks down
everyone sees it
edge is gone
This model is designed to catch Phase 1 → Phase 2 transition.
How to interpret it in practice
1. Healthy / Strong (<35–40)
stock outperforming peers
capital flowing in
safe to hold / add
2. Neutral / Watch (40–60)
early drift vs peers
not actionable yet
but something to monitor
3. Deteriorating (60–70)
consistent underperformance
early institutional rotation away
this is where you:
stop adding
start trimming
4. Breakdown (>70)
statistically meaningful weakness
likely tied to:
earnings revisions
positioning unwind
fundamental shift
This is your exit zone.
When to get out (this is the key part)
The model gives you a structured way to exit without guessing.
Primary exit signal
Score crosses above 70
Score crosses above 70
Interpretation:
“This is no longer noise. This is a real breakdown relative to peers.”
That is your hard exit.
Earlier risk management (before full exit)
You don’t need to wait for 70.
You can manage risk like this:
50–60 → stop adding
60+ → trim
70+ → exit
That creates a graduated response, not all-or-nothing.
Re-entry logic
You don’t just buy when price goes up.
You require:
Score crosses below 35 AND price > trend
Score crosses below 35 AND price > trend
That means:
relative strength has returned
and absolute trend confirms it
So you are buying:
stocks that are re-accelerating vs peers, not just bouncing
Why this works (when it does)
Because it captures something most indicators don’t:
relative capital allocation shifts
Price indicators:
tell you what already happened
This:
tells you where money is going (or leaving)
That’s earlier, and often more actionable.
Where it can fail
It’s important to be honest here.
This will struggle when:
1. Sector is very strong
stock lags slightly
score rises
but stock still performs fine
2. Sector definition is imperfect
ETF doesn’t match true peer set
signal becomes noisy
3. Sideways markets
relative performance oscillates
creates false signals
The correct way to use it
This is not a standalone “buy/sell system.”
It is best used as:
a position management tool
a relative strength filter
a way to identify:
hidden weakness
early deterioration
laggards in strong sectors
開源腳本
秉持TradingView一貫精神,這個腳本的創作者將其設為開源,以便交易者檢視並驗證其功能。向作者致敬!您可以免費使用此腳本,但請注意,重新發佈代碼需遵守我們的社群規範。

免責聲明
這些資訊和出版物並非旨在提供,也不構成TradingView提供或認可的任何形式的財務、投資、交易或其他類型的建議或推薦。請閱讀使用條款以了解更多資訊。
免責聲明
這些資訊和出版物並非旨在提供,也不構成TradingView提供或認可的任何形式的財務、投資、交易或其他類型的建議或推薦。請閱讀使用條款以了解更多資訊。