已更新
RSI Reforged [Probalist Essentials]
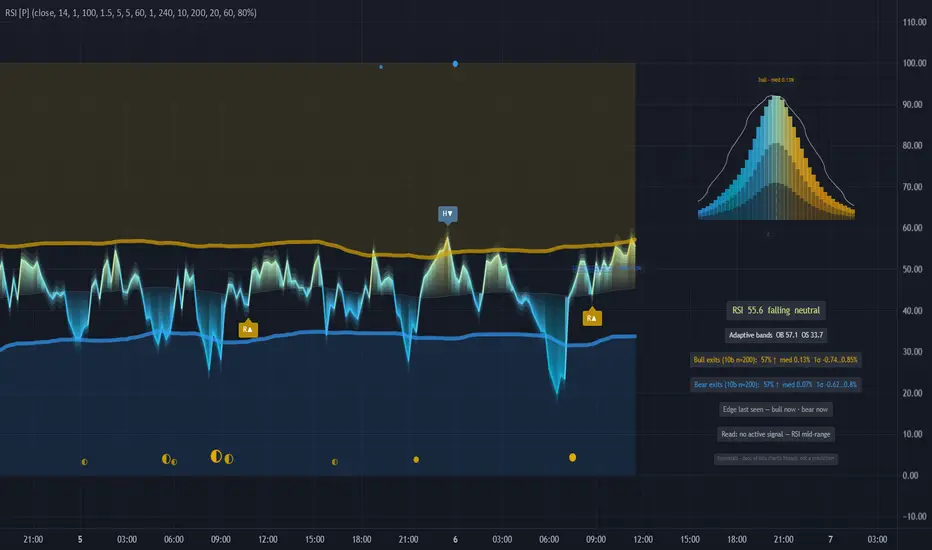
RSI Reforged [Probalist Essentials]
RSI Reforged is the Relative Strength Index done properly for modern trading. It keeps the canonical Wilder formula intact and adds three things that actually change how you use it: adaptive OB/OS bands that move with market volatility instead of sitting at fixed 70/30, auto-labelled regular and hidden divergence on confirmed price pivots, and a forward-return distribution that shows what has historically followed each signal on your specific chart.
It is for momentum traders who want a clean, honest RSI — one that flags the readings that matter without clutter, fires alerts you can act on without worrying about repaint, and shows you the empirical track record of its own signals right on the chart.
🟡 WHY THIS VERSION
The fixed 70/30 bands lie. In a trending market RSI rarely touches 70 before the next leg; in a tight range it hits it constantly. The adaptive bands — mean ± stdev of RSI itself over a rolling window — sit where the actual extremes are for the current regime, so you get fewer false signals in trends and more useful ones in ranges. On top of that, every regular and hidden divergence is labelled automatically on confirmed pivots, no manual squinting. And the probability panel shows you, from this chart's own history, what the closing price looked like 10 bars after a band exit — the win rate, the median move, the spread. It is a description, not a promise, but it is honest in a way most RSI tools are not.
🟡 HOW IT WORKS
The RSI is canonical Wilder (RMA smoothing), optionally EMA-smoothed. The bands are the rolling mean of RSI plus/minus a stdev multiple over a configurable lookback, so overbought and oversold adapt to the regime instead of sitting at 70/30 forever. Divergence pairs confirmed price and RSI pivots within a lookback window. The probability read records, for every confirmed band exit, the percent move N bars later (sign-flipped for bearish signals so positive always means "in the signal's direction"), keeps the most recent outcomes per signal direction in separate rolling buffers (pooling both sides would dilute a one-sided edge toward 50/50), and reports the win rate, median and 16th–84th percentile range per side. The bell curve panel runs a Gaussian kernel over those same outcomes (Silverman bandwidth) and draws the smoothed density right of the last bar, with a normal distribution fitted to the sample mean and stdev overlaid in white — where the fill and the white line disagree, the outcomes are skewed or fat-tailed. All of it is descriptive statistics of this chart's own history, not a forecast.
🟡 KEY FEATURES
• Adaptive OB/OS bands: rolling mean ± stdev of RSI replaces the fixed 70/30 — bands sit where the extremes actually are for the current regime
• Regular + hidden divergence, auto-labelled on confirmed pivots (gold = bullish, blue = bearish, dimmed = hidden)
• Weighted signal dots: band exits render as gold/blue dots — a deeper stretch beyond the band draws a bigger dot, and the fill shows the evidence at fire time (● history backed it, ◐ mixed, ○ no edge measured); hover any dot for its read and outcome
• Probability read: every band exit's forward return (default 10 bars) is recorded separately per direction; the mini-readout shows win rate, median and the 16–84% range with n for bull and bear exits side by side
• The bell curve: a kernel-smoothed distribution of those outcomes for the side of the most recent signal, docked top-right of the last bar, running blue → gold through the Probalist heat ramp, with the fitted Gaussian as a white reference line
• Projection cone from the most recent signal spanning the historical 16–84% band
• Live marker: the still-open signal's running return shown inside the distribution, explicitly labelled live
• Heat gradient wave with a 3-layer glow (one toggle kills all of it for a minimal look)
• Optional display-only higher-timeframe RSI reference line
• Complete alert set, all fired on confirmed bars only — nothing repaints by default
• Read row: one plain-language line applying the stats to the current state — the signal, its age, and whether this chart's history backed it (backed / mixed / no edge)
• Evidence-gated alerts: besides the full alert set, history-backed variants that only fire when the chart's own record supported follow-through at that moment
🟡 HOW TO USE
• Watch the band exits: RSI leaving the oversold band upward (gold dot below) reads as bullish bias; leaving the overbought band downward (blue dot above) as bearish bias
• Bigger dots = deeper excursions before the exit — historically the heavier version of the signal
• Check the readout before acting on a signal: the win rate, median move and 16–84% range tell you what this signal actually did on THIS chart and timeframe — and n tells you how much that's worth
• The bell curve makes the same point visually: a wide, flat curve means noisy outcomes; a tight curve shifted past zero means the signal has had follow-through here
• Divergence labels are confluence, not standalone entries — strongest when they land at a band extreme
• Treat the whole probability layer as a description of history, not a prediction
• Optional: enable the HTF line for higher-timeframe context (display only — it gates nothing)
🟡 PAIRS WELL WITH
RSI Reforged is a momentum tool — it tells you where the oscillator stands and where divergences are forming, but it does not tell you whether the trend is with you or where support and resistance sit. Pair it with a trend-following tool (a moving average or Supertrend) to filter band exits in the direction of the dominant trend, since OS readings in a downtrend are often continuation setups, not reversals. A volume indicator helps confirm whether a divergence has conviction behind it — a divergence on light volume is weaker than one where the volume profile is also shifting. For higher-timeframe context the built-in HTF line is a start, but a dedicated HTF bias indicator can help avoid fading a strong higher-timeframe trend. Key price levels (support, resistance, prior highs/lows) are worth having on the chart too — a band exit into a clean level reads differently from one in open space.
RSI Reforged gives you the classic oscillator with the two upgrades that matter most in practice: bands that fit the current regime and divergence that labels itself on confirmed pivots. The probability panel adds a layer of honest self-assessment — you can see exactly how the signal has performed on your chart without relying on backtested promises. It is a momentum read, not a trading system, and it is built to be trusted.
Open source under MPL-2.0. The probability layer describes past signals on your chart — it is a measurement, not a prediction, and nothing here is financial advice.
發行說明
Updated chart and removed sticky info table, now only realtime. 發行說明
Chart update發行說明
Minor fixes發行說明
Minor changes發行說明
v2 — regime update🟡 NEW PALETTE
The wave now runs the full Probalist vibrant ramp: strong blue → cyan → light blue → mint (the neutral zone) → yellow → amber → orange. The hot/cold pickers set the extremes; the bell curve follows the same ramp.
🟡 REGIME-AWARE PROBABILITY READ
Besides the long-run record, each side now tracks its recent form (last 60 outcomes, adjustable). Markets move in regimes — the Read now tells you whether the signal works NOW, not averaged over years: "recent + long-run back follow-through", "recent form backs it — long-run mixed", or the honest opposite.
🟡 EVIDENCE, NOT AN ARBITRARY BAR
"Backed" now means the Wilson-score lower bound of the win rate clears 50% — automatically strict on small samples, sensitive on large ones. Strictness is selectable (80/90/95%).
🟡 LEANING TIER
An edge that's building but not yet proven shows as "recent form leans bullish/bearish — building, not yet evidence", with a half-filled dot. Alerts still fire on evidence only.
🟡 EDGE CLOCK
The readout shows when each side last had a backed edge: "Edge last seen — bull 3d ago · bear —".
🟡 SMALLER THINGS
Dot tooltips carry the read at fire time (recent + long-run + verdict) plus the completed outcome. The readout panel draws on the chart — it scrolls with it instead of covering price — and has its own toggle; all probability features sit under one master switch. Label spacing and number formatting polish.

免責聲明
這些資訊和出版物並非旨在提供,也不構成TradingView提供或認可的任何形式的財務、投資、交易或其他類型的建議或推薦。請閱讀使用條款以了解更多資訊。