MTF Red Bar Ver:1.0
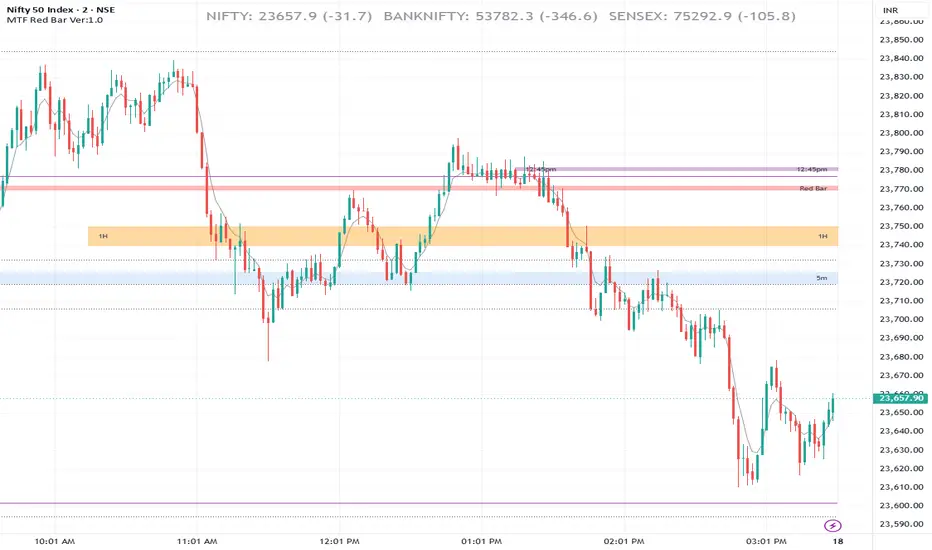
MTF Fibonacci Bands
The script tracks and marks four distinct dynamic horizontal zones (bands)
5m , 5m bearish, 1hour, Mid Hour.
For each tracked window, it plots a shaded structural channel between the 0.44 and 0.50 retracement steps of that specific range.
The 4 Active Intraday Bands:
The 5m Opening Band (09:15 – 09:20):
The Red Bar Band: Formed around the very first 5-minute bearish candle
The 1H Range Band (09:15 – 10:15)
The 12:45pm Mid-day Band (12:45 – 13:15)
Tracks the absolute high, low, and center point of the previous trading day's candle.
EMA 5 Line: Acts as an immediate short-term momentum tracker.
EMA 10/30 Fast Trend Cloud: A shaded ribbon that changes color dynamically based on moving average crossovers (Green for bullish expansion, Red for bearish pressure).
EMA 200 High/Low Channel
The script tracks and marks four distinct dynamic horizontal zones (bands)
5m , 5m bearish, 1hour, Mid Hour.
For each tracked window, it plots a shaded structural channel between the 0.44 and 0.50 retracement steps of that specific range.
The 4 Active Intraday Bands:
The 5m Opening Band (09:15 – 09:20):
The Red Bar Band: Formed around the very first 5-minute bearish candle
The 1H Range Band (09:15 – 10:15)
The 12:45pm Mid-day Band (12:45 – 13:15)
Tracks the absolute high, low, and center point of the previous trading day's candle.
EMA 5 Line: Acts as an immediate short-term momentum tracker.
EMA 10/30 Fast Trend Cloud: A shaded ribbon that changes color dynamically based on moving average crossovers (Green for bullish expansion, Red for bearish pressure).
EMA 200 High/Low Channel

免責聲明
這些資訊和出版物並非旨在提供,也不構成TradingView提供或認可的任何形式的財務、投資、交易或其他類型的建議或推薦。請閱讀使用條款以了解更多資訊。
免責聲明
這些資訊和出版物並非旨在提供,也不構成TradingView提供或認可的任何形式的財務、投資、交易或其他類型的建議或推薦。請閱讀使用條款以了解更多資訊。