Renko RSI (ticker.renko)
Renko RSI (ticker.renko)
WHAT IT IS
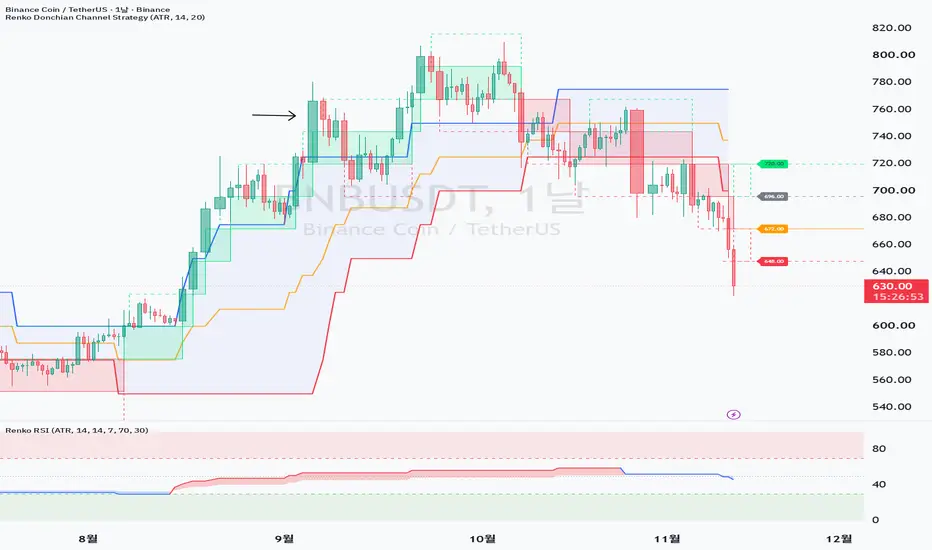
An RSI that is calculated on Renko bricks instead of time-based candles. Every Renko brick counts as one bar, so the oscillator ignores time and reacts only to price moves of a fixed size. The indicator also shows an EMA signal line, direction colors and overbought / oversold zones.
HOW IT WORKS
1) Renko data
The script builds a Renko series with TradingView's built-in ticker.renko() and requests it with request.security() (barmerge.gaps_off, barmerge.lookahead_off, no look-ahead).
- Renko Style: "ATR" (box size from ATR) or "Traditional" (fixed box size)
- Renko Box Size / ATR Length: default 14
2) RSI on bricks
The RSI is calculated inside the Renko context on the brick closes, so the length counts bricks, not chart bars:
- Renko RSI = RSI of the brick closes (default length 14)
- Signal = EMA of the Renko RSI (default length 7)
The result is returned to your chart as a normal series: each chart bar shows the value of the latest brick at that time. While no new brick forms, the value stays the same.
HOW TO READ IT
- Renko RSI Line: red while it rises, blue while it falls; the previous color is kept while it is unchanged.
- The area between the line and the Signal is filled red when the line is above the Signal and blue when it is below.
- Overbought zone (default 70-100) and oversold zone (default 0-30) are shaded; the 50 line is the midline.
- Values are shown as integers. The Signal line itself is hidden by default; its fill is shown. The Renko close is available in the Data Window.
- Because each brick has the same size, the RSI moves in steps and does not change while price moves inside a brick.
SETTINGS
Renko Settings: Renko Style, Renko Box Size / ATR Length
Renko RSI: RSI length (bricks), Signal length (EMA, bricks), Overbought level, Oversold level
NOTES
- The Renko bricks come from ticker.renko(), so the history can differ from other Renko tools or from a Renko chart type. The brick that is still forming can change while the candle is open, so the last value can change until a brick is confirmed.
- On very large brick sizes the RSI changes only a few times; check that the brick size matches the timeframe you use.
- This is an indicator only. It does not place orders or generate alerts.
- Past behavior does not guarantee future results. This script is for educational and informational purposes only and is not financial advice. Use at your own risk.
======================================
Renko RSI (ticker.renko) (렌코 RSI)
개요
시간 기반 캔들 대신 렌코 브릭 위에서 계산하는 RSI입니다. 렌코 브릭 하나를 봉 하나로 치기 때문에, 이 오실레이터는 시간을 무시하고 일정한 크기의 가격 움직임에만 반응합니다. EMA 시그널선, 방향 색상, 과매수·과매도 구간도 함께 표시합니다.
작동 방식
1) 렌코 데이터
TradingView 내장 ticker.renko()로 렌코 시리즈를 만들고 request.security()로 가져옵니다(barmerge.gaps_off, barmerge.lookahead_off, 미래 데이터 참조 없음).
- Renko Style: "ATR"(ATR 기반 브릭 크기) 또는 "Traditional"(고정 브릭 크기)
- Renko Box Size / ATR Length: 기본값 14
2) 브릭 기준 RSI
RSI는 렌코 내부에서 브릭 종가 기준으로 계산하므로, 길이는 차트 봉이 아니라 브릭 개수입니다.
- Renko RSI = 브릭 종가의 RSI(기본 길이 14)
- Signal = Renko RSI의 EMA(기본 길이 7)
결과는 일반 시리즈로 차트에 돌려줍니다. 각 차트 봉에는 그 시점의 최신 브릭 값이 표시되고, 새 브릭이 생기지 않는 동안에는 값이 그대로 유지됩니다.
읽는 방법
- Renko RSI Line: 상승 중이면 빨강, 하락 중이면 파랑이고, 값이 같으면 이전 색을 유지합니다.
- 선과 Signal 사이 영역은 선이 Signal보다 위면 빨강, 아래면 파랑으로 채웁니다.
- 과매수 구간(기본 70~100)과 과매도 구간(기본 0~30)이 음영으로 표시되고, 50선이 중심선입니다.
- 값은 정수로 표시됩니다. Signal 선 자체는 기본적으로 숨겨져 있고 채우기만 보입니다. 렌코 종가는 데이터 창에서 확인할 수 있습니다.
- 모든 브릭의 크기가 같아서, RSI는 계단식으로 움직이며 가격이 브릭 안에서 움직이는 동안에는 바뀌지 않습니다.
설정
Renko Settings: Renko Style, Renko Box Size / ATR Length
Renko RSI: RSI length (bricks), Signal length (EMA, bricks), Overbought level, Oversold level
유의사항
- 렌코 브릭은 ticker.renko()에서 가져오므로, 과거 구간이 다른 렌코 도구나 렌코 차트 유형과 다를 수 있습니다. 아직 형성 중인 브릭은 캔들이 진행되는 동안 바뀔 수 있어서, 브릭이 확정될 때까지 마지막 값이 변할 수 있습니다.
- 브릭 크기가 매우 크면 RSI가 몇 번밖에 바뀌지 않습니다. 사용하는 시간봉에 맞는 브릭 크기인지 확인하세요.
- 이 지표는 지표일 뿐이며 주문을 내거나 알림을 만들지 않습니다.
- 과거 동작이 미래 결과를 보장하지 않습니다. 이 스크립트는 교육 및 정보 제공용이며 투자 조언이 아닙니다. 사용에 따른 책임은 사용자에게 있습니다.
WHAT IT IS
An RSI that is calculated on Renko bricks instead of time-based candles. Every Renko brick counts as one bar, so the oscillator ignores time and reacts only to price moves of a fixed size. The indicator also shows an EMA signal line, direction colors and overbought / oversold zones.
HOW IT WORKS
1) Renko data
The script builds a Renko series with TradingView's built-in ticker.renko() and requests it with request.security() (barmerge.gaps_off, barmerge.lookahead_off, no look-ahead).
- Renko Style: "ATR" (box size from ATR) or "Traditional" (fixed box size)
- Renko Box Size / ATR Length: default 14
2) RSI on bricks
The RSI is calculated inside the Renko context on the brick closes, so the length counts bricks, not chart bars:
- Renko RSI = RSI of the brick closes (default length 14)
- Signal = EMA of the Renko RSI (default length 7)
The result is returned to your chart as a normal series: each chart bar shows the value of the latest brick at that time. While no new brick forms, the value stays the same.
HOW TO READ IT
- Renko RSI Line: red while it rises, blue while it falls; the previous color is kept while it is unchanged.
- The area between the line and the Signal is filled red when the line is above the Signal and blue when it is below.
- Overbought zone (default 70-100) and oversold zone (default 0-30) are shaded; the 50 line is the midline.
- Values are shown as integers. The Signal line itself is hidden by default; its fill is shown. The Renko close is available in the Data Window.
- Because each brick has the same size, the RSI moves in steps and does not change while price moves inside a brick.
SETTINGS
Renko Settings: Renko Style, Renko Box Size / ATR Length
Renko RSI: RSI length (bricks), Signal length (EMA, bricks), Overbought level, Oversold level
NOTES
- The Renko bricks come from ticker.renko(), so the history can differ from other Renko tools or from a Renko chart type. The brick that is still forming can change while the candle is open, so the last value can change until a brick is confirmed.
- On very large brick sizes the RSI changes only a few times; check that the brick size matches the timeframe you use.
- This is an indicator only. It does not place orders or generate alerts.
- Past behavior does not guarantee future results. This script is for educational and informational purposes only and is not financial advice. Use at your own risk.
======================================
Renko RSI (ticker.renko) (렌코 RSI)
개요
시간 기반 캔들 대신 렌코 브릭 위에서 계산하는 RSI입니다. 렌코 브릭 하나를 봉 하나로 치기 때문에, 이 오실레이터는 시간을 무시하고 일정한 크기의 가격 움직임에만 반응합니다. EMA 시그널선, 방향 색상, 과매수·과매도 구간도 함께 표시합니다.
작동 방식
1) 렌코 데이터
TradingView 내장 ticker.renko()로 렌코 시리즈를 만들고 request.security()로 가져옵니다(barmerge.gaps_off, barmerge.lookahead_off, 미래 데이터 참조 없음).
- Renko Style: "ATR"(ATR 기반 브릭 크기) 또는 "Traditional"(고정 브릭 크기)
- Renko Box Size / ATR Length: 기본값 14
2) 브릭 기준 RSI
RSI는 렌코 내부에서 브릭 종가 기준으로 계산하므로, 길이는 차트 봉이 아니라 브릭 개수입니다.
- Renko RSI = 브릭 종가의 RSI(기본 길이 14)
- Signal = Renko RSI의 EMA(기본 길이 7)
결과는 일반 시리즈로 차트에 돌려줍니다. 각 차트 봉에는 그 시점의 최신 브릭 값이 표시되고, 새 브릭이 생기지 않는 동안에는 값이 그대로 유지됩니다.
읽는 방법
- Renko RSI Line: 상승 중이면 빨강, 하락 중이면 파랑이고, 값이 같으면 이전 색을 유지합니다.
- 선과 Signal 사이 영역은 선이 Signal보다 위면 빨강, 아래면 파랑으로 채웁니다.
- 과매수 구간(기본 70~100)과 과매도 구간(기본 0~30)이 음영으로 표시되고, 50선이 중심선입니다.
- 값은 정수로 표시됩니다. Signal 선 자체는 기본적으로 숨겨져 있고 채우기만 보입니다. 렌코 종가는 데이터 창에서 확인할 수 있습니다.
- 모든 브릭의 크기가 같아서, RSI는 계단식으로 움직이며 가격이 브릭 안에서 움직이는 동안에는 바뀌지 않습니다.
설정
Renko Settings: Renko Style, Renko Box Size / ATR Length
Renko RSI: RSI length (bricks), Signal length (EMA, bricks), Overbought level, Oversold level
유의사항
- 렌코 브릭은 ticker.renko()에서 가져오므로, 과거 구간이 다른 렌코 도구나 렌코 차트 유형과 다를 수 있습니다. 아직 형성 중인 브릭은 캔들이 진행되는 동안 바뀔 수 있어서, 브릭이 확정될 때까지 마지막 값이 변할 수 있습니다.
- 브릭 크기가 매우 크면 RSI가 몇 번밖에 바뀌지 않습니다. 사용하는 시간봉에 맞는 브릭 크기인지 확인하세요.
- 이 지표는 지표일 뿐이며 주문을 내거나 알림을 만들지 않습니다.
- 과거 동작이 미래 결과를 보장하지 않습니다. 이 스크립트는 교육 및 정보 제공용이며 투자 조언이 아닙니다. 사용에 따른 책임은 사용자에게 있습니다.

[Practical trading strategy using HA-MS and SBOD]
youtu.be/aceN1AttX1Y
[Web Site]
readcrypto.kr
- Chart pattern analysis has been added.
youtu.be/aceN1AttX1Y
[Web Site]
readcrypto.kr
- Chart pattern analysis has been added.
免責聲明
這些資訊和出版物並非旨在提供,也不構成TradingView提供或認可的任何形式的財務、投資、交易或其他類型的建議或推薦。請閱讀使用條款以了解更多資訊。
[Practical trading strategy using HA-MS and SBOD]
youtu.be/aceN1AttX1Y
[Web Site]
readcrypto.kr
- Chart pattern analysis has been added.
youtu.be/aceN1AttX1Y
[Web Site]
readcrypto.kr
- Chart pattern analysis has been added.
免責聲明
這些資訊和出版物並非旨在提供,也不構成TradingView提供或認可的任何形式的財務、投資、交易或其他類型的建議或推薦。請閱讀使用條款以了解更多資訊。