Premium / Discount Zones
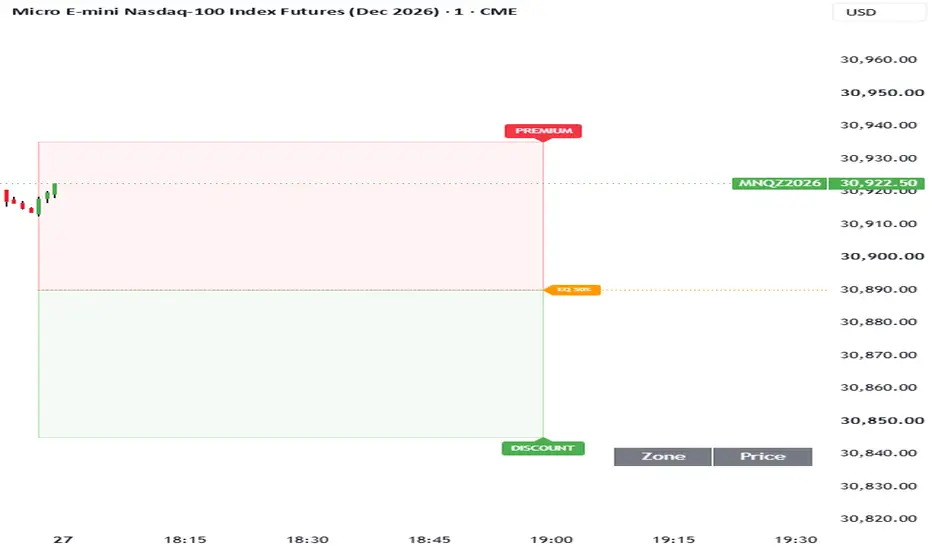
A standalone ~30-line indicator that splits the current dealing range into premium (upper half) and discount (lower half), with the 50% equilibrium as the divider. It's the smart-money framing layer — buy in discount, sell in premium.
How it calculates: It takes the highest high and lowest low over the lookback window, then splits that range at the midpoint:
Premium = midpoint → range high (red tint)
Discount = range low → midpoint (green tint)
Equilibrium (EQ 50%) = the midpoint itself (orange dotted line, extends right)
What it draws:
Premium box (red tint) — upper half
Discount box (green tint) — lower half
EQ 50% line (orange dotted, extends right)
PREMIUM / DISCOUNT / EQ 50% labels at the right edge
Range table bottom-right with the three live prices
Inputs (all under Range):
Input Default Notes
Range Lookback (bars) 100 On your 1-min MNQ chart ≈ last 100 minutes
Right Extension (bars) 60 How far boxes project forward
Fill Opacity 94 Lower = more opaque
Show Range / Labels / EQ Line / Table all on Individual toggles
Two things to know about the defaults:
1. 100 bars on a 1-minute chart is a short range. The original HTF & CISD PRO measured 100 HTF bars (≈2.5 weeks on 4H). This one measures 100 chart bars, so on your 1-min MNQ chart the dealing range is roughly the last 100 minutes — an intraday range, not a swing range. Bump the lookback if you want a wider window.
2. It's rolling, not session-anchored. The range recomputes every bar, so the premium/discount boundaries drift as old highs/lows fall out of the lookback window. That's standard ICT dealing-range behaviour — but it means the zones aren't fixed for the session.
Why it's standalone: No request.security, no lookahead, so nothing on it repaints. It was deliberately kept single-purpose to avoid colliding with the CISD/FVG/sweep layers you already run — the original script would have put a second HTF & CISD PRO on your chart.
How to use it: Price in discount + bullish structure = look for longs. Price in premium + bearish structure = look for shorts. Price at EQ = no edge, wait. It's a location filter, not a trigger — it tells you whether the price you're paying is cheap or expensive within the current range, and the actual entry still comes from your sweep/CISD/fib layers.
How it calculates: It takes the highest high and lowest low over the lookback window, then splits that range at the midpoint:
Premium = midpoint → range high (red tint)
Discount = range low → midpoint (green tint)
Equilibrium (EQ 50%) = the midpoint itself (orange dotted line, extends right)
What it draws:
Premium box (red tint) — upper half
Discount box (green tint) — lower half
EQ 50% line (orange dotted, extends right)
PREMIUM / DISCOUNT / EQ 50% labels at the right edge
Range table bottom-right with the three live prices
Inputs (all under Range):
Input Default Notes
Range Lookback (bars) 100 On your 1-min MNQ chart ≈ last 100 minutes
Right Extension (bars) 60 How far boxes project forward
Fill Opacity 94 Lower = more opaque
Show Range / Labels / EQ Line / Table all on Individual toggles
Two things to know about the defaults:
1. 100 bars on a 1-minute chart is a short range. The original HTF & CISD PRO measured 100 HTF bars (≈2.5 weeks on 4H). This one measures 100 chart bars, so on your 1-min MNQ chart the dealing range is roughly the last 100 minutes — an intraday range, not a swing range. Bump the lookback if you want a wider window.
2. It's rolling, not session-anchored. The range recomputes every bar, so the premium/discount boundaries drift as old highs/lows fall out of the lookback window. That's standard ICT dealing-range behaviour — but it means the zones aren't fixed for the session.
Why it's standalone: No request.security, no lookahead, so nothing on it repaints. It was deliberately kept single-purpose to avoid colliding with the CISD/FVG/sweep layers you already run — the original script would have put a second HTF & CISD PRO on your chart.
How to use it: Price in discount + bullish structure = look for longs. Price in premium + bearish structure = look for shorts. Price at EQ = no edge, wait. It's a location filter, not a trigger — it tells you whether the price you're paying is cheap or expensive within the current range, and the actual entry still comes from your sweep/CISD/fib layers.

免責聲明
這些資訊和出版物並非旨在提供,也不構成TradingView提供或認可的任何形式的財務、投資、交易或其他類型的建議或推薦。請閱讀使用條款以了解更多資訊。
免責聲明
這些資訊和出版物並非旨在提供,也不構成TradingView提供或認可的任何形式的財務、投資、交易或其他類型的建議或推薦。請閱讀使用條款以了解更多資訊。