Efficiency-Adaptive Trend Trail [Jayadev Rana]
OVERVIEW
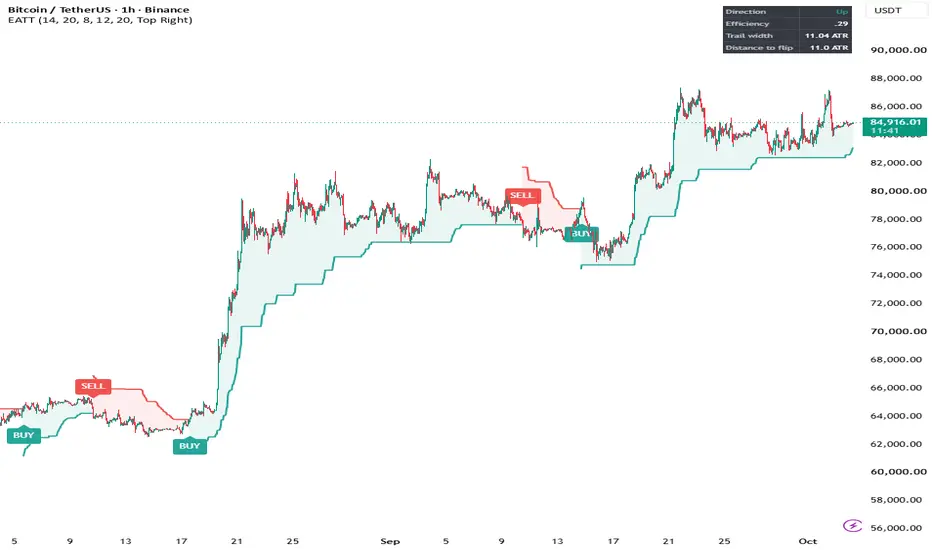
Efficiency-Adaptive Trend Trail is a trend-following overlay that prints BUY and SELL signals when price closes through a ratcheting trailing line. What makes it different from a fixed ATR trail is that the trail distance is not constant: it is driven by the Kaufman efficiency ratio, so the line sits closer to price while the market is moving in a straight line and backs away while the market is rotating.
HOW IT WORKS
1. Efficiency ratio. Over the Efficiency Length the script divides the net price change by the sum of all bar-to-bar changes. A value near 1 means price travelled in a straight line; a value near 0 means it moved a lot and went nowhere.
2. Adaptive width. The trail distance in ATRs is interpolated between two user values: the Wide Multiplier applies when efficiency is 0 and the Tight Multiplier applies when efficiency is 1. The result is smoothed with an EMA so the distance changes gradually instead of jumping from bar to bar.
3. Ratcheting trail. In an up state the trail is the highest value so far of (close minus distance), so it can only rise. In a down state it is the lowest value so far of (close plus distance), so it can only fall. A close through the trail flips the state and restarts the trail on the other side of price.
The idea behind the adaptation: a choppy market needs room, otherwise every swing flips the state, while a clean trend can be followed more closely because pullbacks inside it are shallow relative to its progress.
SIGNALS
- BUY: a bar closes above the trail while the state was down.
- SELL: a bar closes below the trail while the state was up.
The state is always either up or down, so signals alternate by construction. Signals are evaluated on closed bars and are not changed afterwards.
DASHBOARD
Direction, current efficiency ratio, current trail width in ATRs, and the distance from price to the flip level in ATRs.
SETTINGS
Core: ATR Length, Efficiency Length, Tight Multiplier (Efficient Trend), Wide Multiplier (Choppy Market), Multiplier Smoothing, Color Bars by Direction.
Dashboard: visibility and position.
Style: colors.
DEFAULT SETTINGS
The default values were chosen with a parameter search on BTCUSDT on the 1-hour timeframe. The search treated the signals as a stop-and-reverse system with trading costs, split the history into an earlier and a later segment, and kept only settings that held up in both segments. The search favored wide multipliers on that market, which means few signals and long holding periods. Other symbols and timeframes will usually need different values, typically smaller multipliers on higher timeframes; treat the defaults as a starting point and not as a recommendation.
ALERTS
Buy Signal, Sell Signal.
LIMITATIONS
- This is a trend-following tool. During long sideways periods it will flip late and give back part of the previous move.
- The trail is close-based. Intrabar spikes through the line that do not hold into the close do not flip the state, and a flip is only known at the close.
- The efficiency ratio describes the recent past. A market can turn from trending to rotating faster than the ratio can register.
- Wide default multipliers mean the line can sit far from price; the distance shown on the dashboard is the amount of adverse movement the current state tolerates.
- Settings tuned on past data can stop working when market behavior changes.
This script is for analysis and education. It does not provide financial advice, and past behavior of any signal does not guarantee future results.
Efficiency-Adaptive Trend Trail is a trend-following overlay that prints BUY and SELL signals when price closes through a ratcheting trailing line. What makes it different from a fixed ATR trail is that the trail distance is not constant: it is driven by the Kaufman efficiency ratio, so the line sits closer to price while the market is moving in a straight line and backs away while the market is rotating.
HOW IT WORKS
1. Efficiency ratio. Over the Efficiency Length the script divides the net price change by the sum of all bar-to-bar changes. A value near 1 means price travelled in a straight line; a value near 0 means it moved a lot and went nowhere.
2. Adaptive width. The trail distance in ATRs is interpolated between two user values: the Wide Multiplier applies when efficiency is 0 and the Tight Multiplier applies when efficiency is 1. The result is smoothed with an EMA so the distance changes gradually instead of jumping from bar to bar.
3. Ratcheting trail. In an up state the trail is the highest value so far of (close minus distance), so it can only rise. In a down state it is the lowest value so far of (close plus distance), so it can only fall. A close through the trail flips the state and restarts the trail on the other side of price.
The idea behind the adaptation: a choppy market needs room, otherwise every swing flips the state, while a clean trend can be followed more closely because pullbacks inside it are shallow relative to its progress.
SIGNALS
- BUY: a bar closes above the trail while the state was down.
- SELL: a bar closes below the trail while the state was up.
The state is always either up or down, so signals alternate by construction. Signals are evaluated on closed bars and are not changed afterwards.
DASHBOARD
Direction, current efficiency ratio, current trail width in ATRs, and the distance from price to the flip level in ATRs.
SETTINGS
Core: ATR Length, Efficiency Length, Tight Multiplier (Efficient Trend), Wide Multiplier (Choppy Market), Multiplier Smoothing, Color Bars by Direction.
Dashboard: visibility and position.
Style: colors.
DEFAULT SETTINGS
The default values were chosen with a parameter search on BTCUSDT on the 1-hour timeframe. The search treated the signals as a stop-and-reverse system with trading costs, split the history into an earlier and a later segment, and kept only settings that held up in both segments. The search favored wide multipliers on that market, which means few signals and long holding periods. Other symbols and timeframes will usually need different values, typically smaller multipliers on higher timeframes; treat the defaults as a starting point and not as a recommendation.
ALERTS
Buy Signal, Sell Signal.
LIMITATIONS
- This is a trend-following tool. During long sideways periods it will flip late and give back part of the previous move.
- The trail is close-based. Intrabar spikes through the line that do not hold into the close do not flip the state, and a flip is only known at the close.
- The efficiency ratio describes the recent past. A market can turn from trending to rotating faster than the ratio can register.
- Wide default multipliers mean the line can sit far from price; the distance shown on the dashboard is the amount of adverse movement the current state tolerates.
- Settings tuned on past data can stop working when market behavior changes.
This script is for analysis and education. It does not provide financial advice, and past behavior of any signal does not guarantee future results.

免責聲明
這些資訊和出版物並非旨在提供,也不構成TradingView提供或認可的任何形式的財務、投資、交易或其他類型的建議或推薦。請閱讀使用條款以了解更多資訊。
免責聲明
這些資訊和出版物並非旨在提供,也不構成TradingView提供或認可的任何形式的財務、投資、交易或其他類型的建議或推薦。請閱讀使用條款以了解更多資訊。