Wave Effort Map [AFD]
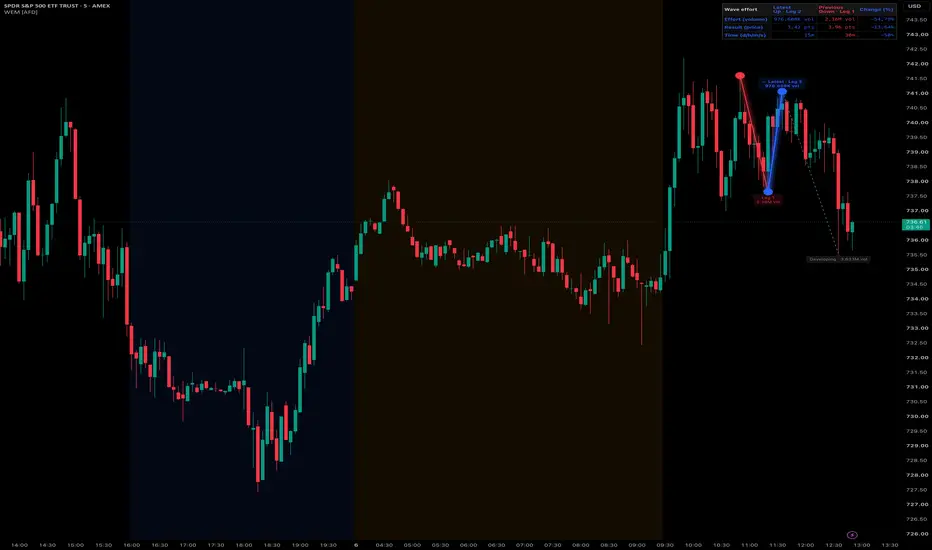
Wave Effort Map [AFD] compares total reported volume, price distance and elapsed time between consecutive finalized price waves. It places the latest completed leg beside its immediate predecessor and keeps a separate gray dashed developing leg.
HOW WAVES ARE FORMED
• The detector follows an extreme and waits for a later closed bar to reverse by the selected ATR multiple.
• ATR length sets the volatility lookback; ATR reversal multiple sets the required reversal distance, using the ATR recorded at the extreme.
• A new extreme takes priority over a same-bar reversal.
• The first partial leg is excluded.
• Finalized paths are drawn retrospectively at their measured endpoints after confirmation; the extreme and confirmation can be several bars apart.
WHAT IS MEASURED
• Effort: total reported feed volume over the bars after the starting endpoint through the ending endpoint. It is neither buyer/seller volume nor order-flow delta.
• Result: the absolute distance between endpoint prices.
• Time: elapsed time between endpoint-bar openings, including session gaps, rather than the exact intrabar time of the high or low.
• Bars: the endpoint bar-index difference.
READING THE DISPLAY
• Up legs default to blue and down legs to red. Color describes price direction, not a favorable or unfavorable outcome.
• The visible finalized pair renumbers as Leg 1 and Leg 2.
• Endpoint dots mark the measured start and end of each finalized path; at the shared pivot the newer leg's dot appears on top.
• All Latest values, metric labels and Change values use the latest leg's color; Previous uses its own leg color. Unavailable volume is muted.
• Label spacing adjusts text distance from endpoints. The table supports nine positions.
COMPARISON TABLE
• Latest and Previous carry explicit units.
• Compact shows percentage change; Detailed adds bars, minutes and signed unit changes above the percentages.
• Changes are Latest minus Previous, with percentage change divided by Previous.
• A positive result-distance change means the latest leg covered more price distance; a positive time change means it took longer.
• Price points are raw quoted price units, not a tick/pip count or monetary profit. Volume may be abbreviated K/M/B.
• Grid-representable prices compare by integer tick counts. Off-grid adjusted distances are marked approximate (≈); if input precision cannot resolve a comparison, it says Precision limited.
• Engineering notation preserves tiny or very large nonzero magnitudes.
• A valid unit difference can remain available when a zero baseline makes percentage change unavailable.
VOLUME ICONS
• Optional minus, equals, zero and question-mark icons indicate less volume, equal volume within tolerance, both legs reporting zero, or unavailable volume versus each leg's own preceding finalized leg. More volume has no icon.
• The first complete leg has no comparison; the earlier displayed leg's reference may be outside the visible pair.
• Volume icons, volume unit changes and volume percentages use the same small equality tolerance; a tolerance-equal comparison shows zero units and zero percent.
• Zero reported volume is valid data: two zero-volume legs show Both report zero volume with a 0 icon, while percentage change from zero is N/A. This does not establish that the feed measures actual traded activity.
ALERTS
• Optional finalization alerts describe a completed leg at its confirming bar close; they are off by default.
DEVELOPING VALUES AND DATA LIMITS
• The developing leg updates on closed bars, can extend or be reassigned, and is excluded from the finalized comparison. Its endpoint follows the candidate extreme rather than the latest close.
• Reported volume availability and meaning depend on the symbol and data provider; missing or invalid interval volume makes effort unavailable.
• Feed corrections, session selection, loaded history and detector initialization can change the resulting waves.
• The detector restarts after invalid price/ATR data or an overlong unconfirmed segment.
• Standard time-based candles are required; unsupported charts show a status message.
• Chart and table text can overlap; positions and sizes are manual controls.
Source is released under MPL 2.0; TradingView's open-source reuse rules apply on its platform.
HOW WAVES ARE FORMED
• The detector follows an extreme and waits for a later closed bar to reverse by the selected ATR multiple.
• ATR length sets the volatility lookback; ATR reversal multiple sets the required reversal distance, using the ATR recorded at the extreme.
• A new extreme takes priority over a same-bar reversal.
• The first partial leg is excluded.
• Finalized paths are drawn retrospectively at their measured endpoints after confirmation; the extreme and confirmation can be several bars apart.
WHAT IS MEASURED
• Effort: total reported feed volume over the bars after the starting endpoint through the ending endpoint. It is neither buyer/seller volume nor order-flow delta.
• Result: the absolute distance between endpoint prices.
• Time: elapsed time between endpoint-bar openings, including session gaps, rather than the exact intrabar time of the high or low.
• Bars: the endpoint bar-index difference.
READING THE DISPLAY
• Up legs default to blue and down legs to red. Color describes price direction, not a favorable or unfavorable outcome.
• The visible finalized pair renumbers as Leg 1 and Leg 2.
• Endpoint dots mark the measured start and end of each finalized path; at the shared pivot the newer leg's dot appears on top.
• All Latest values, metric labels and Change values use the latest leg's color; Previous uses its own leg color. Unavailable volume is muted.
• Label spacing adjusts text distance from endpoints. The table supports nine positions.
COMPARISON TABLE
• Latest and Previous carry explicit units.
• Compact shows percentage change; Detailed adds bars, minutes and signed unit changes above the percentages.
• Changes are Latest minus Previous, with percentage change divided by Previous.
• A positive result-distance change means the latest leg covered more price distance; a positive time change means it took longer.
• Price points are raw quoted price units, not a tick/pip count or monetary profit. Volume may be abbreviated K/M/B.
• Grid-representable prices compare by integer tick counts. Off-grid adjusted distances are marked approximate (≈); if input precision cannot resolve a comparison, it says Precision limited.
• Engineering notation preserves tiny or very large nonzero magnitudes.
• A valid unit difference can remain available when a zero baseline makes percentage change unavailable.
VOLUME ICONS
• Optional minus, equals, zero and question-mark icons indicate less volume, equal volume within tolerance, both legs reporting zero, or unavailable volume versus each leg's own preceding finalized leg. More volume has no icon.
• The first complete leg has no comparison; the earlier displayed leg's reference may be outside the visible pair.
• Volume icons, volume unit changes and volume percentages use the same small equality tolerance; a tolerance-equal comparison shows zero units and zero percent.
• Zero reported volume is valid data: two zero-volume legs show Both report zero volume with a 0 icon, while percentage change from zero is N/A. This does not establish that the feed measures actual traded activity.
ALERTS
• Optional finalization alerts describe a completed leg at its confirming bar close; they are off by default.
DEVELOPING VALUES AND DATA LIMITS
• The developing leg updates on closed bars, can extend or be reassigned, and is excluded from the finalized comparison. Its endpoint follows the candidate extreme rather than the latest close.
• Reported volume availability and meaning depend on the symbol and data provider; missing or invalid interval volume makes effort unavailable.
• Feed corrections, session selection, loaded history and detector initialization can change the resulting waves.
• The detector restarts after invalid price/ATR data or an overlong unconfirmed segment.
• Standard time-based candles are required; unsupported charts show a status message.
• Chart and table text can overlap; positions and sizes are manual controls.
Source is released under MPL 2.0; TradingView's open-source reuse rules apply on its platform.

Auction Foundry — see the auction more clearly. Educational tools; not investment advice.
Discord support: discord.gg/df6XEnyGC6
Website: auction-foundry.io
Instagram: instagram.com/AuctionFoundry
X: @AuctionFoundry
Discord support: discord.gg/df6XEnyGC6
Website: auction-foundry.io
Instagram: instagram.com/AuctionFoundry
X: @AuctionFoundry
免責聲明
這些資訊和出版物並非旨在提供,也不構成TradingView提供或認可的任何形式的財務、投資、交易或其他類型的建議或推薦。請閱讀使用條款以了解更多資訊。
Auction Foundry — see the auction more clearly. Educational tools; not investment advice.
Discord support: discord.gg/df6XEnyGC6
Website: auction-foundry.io
Instagram: instagram.com/AuctionFoundry
X: @AuctionFoundry
Discord support: discord.gg/df6XEnyGC6
Website: auction-foundry.io
Instagram: instagram.com/AuctionFoundry
X: @AuctionFoundry
免責聲明
這些資訊和出版物並非旨在提供,也不構成TradingView提供或認可的任何形式的財務、投資、交易或其他類型的建議或推薦。請閱讀使用條款以了解更多資訊。