已更新
Wyckoff Distribution Tracker
Wyckoff Distribution Tracker
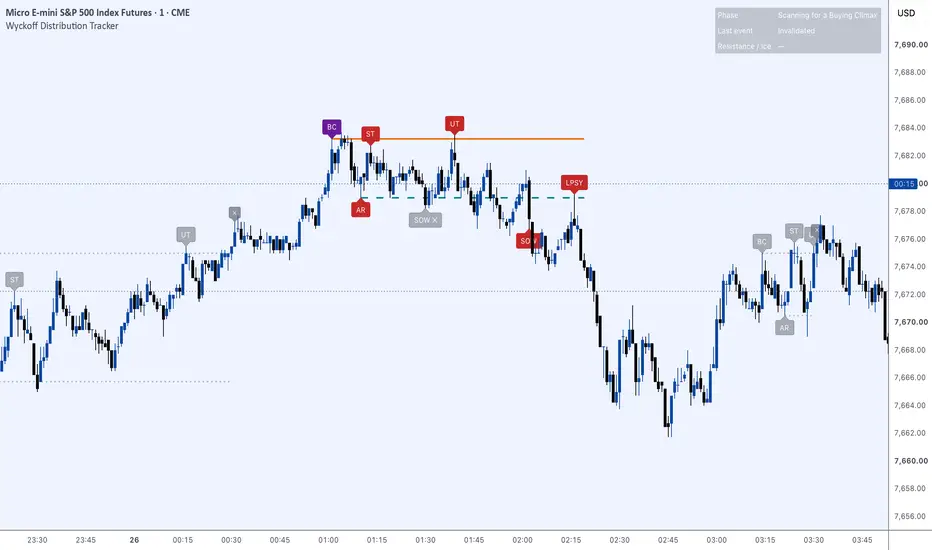
The mirror of the Wyckoff Accumulation Tracker. Tracks a distribution range as it forms, one event at a time, and only prints each event once the earlier ones exist: Buying Climax → Automatic Reaction → Secondary Test → Upthrust → Test of the Upthrust → Sign of Weakness → Last Point of Supply. Resistance and the Ice (the bottom of the range) extend as lines while the structure is live.
Events. BC is a euphoric high on climactic volume and spread in an uptrend. AR is the first swing low after it and sets the Ice. ST revisits the climax area on lighter volume. UT is a brief push above resistance that is quickly rejected, the upthrust, or UTAD when it comes late in the range. Test is a lower high on lighter volume. SOW is a wide-spread, high-volume close below the Ice. LPSY is the rally back to the Ice on lighter volume, old support acting as resistance.
Invalidation. A new high without climactic volume, a close above resistance before the Secondary Test, an upthrust that runs too far or holds above resistance (a real breakout, not an upthrust), or a range that doesn't resolve within the bar limit gray out the structure and the scanner starts over. A SOW that closes back inside the range is marked SOW ✕ and the range continues.
Status table shows the phase, last event, and Resistance / Ice. Alerts for every event, for a failed SOW, and for invalidation. Set alerts to Once Per Bar Close.
Notes. Swing points (AR, ST, Test, LPSY) are confirmed a set number of bars after they print, so their labels appear with that lag, placed on the bar they belong to. Everything is inferred from price and volume structure, not order flow.
It's context for your own analysis, not a signal service. Run it alongside the Accumulation Tracker on the same chart to see both sides of the campaign; test it on your market and timeframe before relying on it.
The mirror of the Wyckoff Accumulation Tracker. Tracks a distribution range as it forms, one event at a time, and only prints each event once the earlier ones exist: Buying Climax → Automatic Reaction → Secondary Test → Upthrust → Test of the Upthrust → Sign of Weakness → Last Point of Supply. Resistance and the Ice (the bottom of the range) extend as lines while the structure is live.
Events. BC is a euphoric high on climactic volume and spread in an uptrend. AR is the first swing low after it and sets the Ice. ST revisits the climax area on lighter volume. UT is a brief push above resistance that is quickly rejected, the upthrust, or UTAD when it comes late in the range. Test is a lower high on lighter volume. SOW is a wide-spread, high-volume close below the Ice. LPSY is the rally back to the Ice on lighter volume, old support acting as resistance.
Invalidation. A new high without climactic volume, a close above resistance before the Secondary Test, an upthrust that runs too far or holds above resistance (a real breakout, not an upthrust), or a range that doesn't resolve within the bar limit gray out the structure and the scanner starts over. A SOW that closes back inside the range is marked SOW ✕ and the range continues.
Status table shows the phase, last event, and Resistance / Ice. Alerts for every event, for a failed SOW, and for invalidation. Set alerts to Once Per Bar Close.
Notes. Swing points (AR, ST, Test, LPSY) are confirmed a set number of bars after they print, so their labels appear with that lag, placed on the bar they belong to. Everything is inferred from price and volume structure, not order flow.
It's context for your own analysis, not a signal service. Run it alongside the Accumulation Tracker on the same chart to see both sides of the campaign; test it on your market and timeframe before relying on it.
發行說明
Updated Image
免責聲明
這些資訊和出版物並非旨在提供,也不構成TradingView提供或認可的任何形式的財務、投資、交易或其他類型的建議或推薦。請閱讀使用條款以了解更多資訊。