OPEN-SOURCE SCRIPT
Adaptive Flow & Volatility Baseline
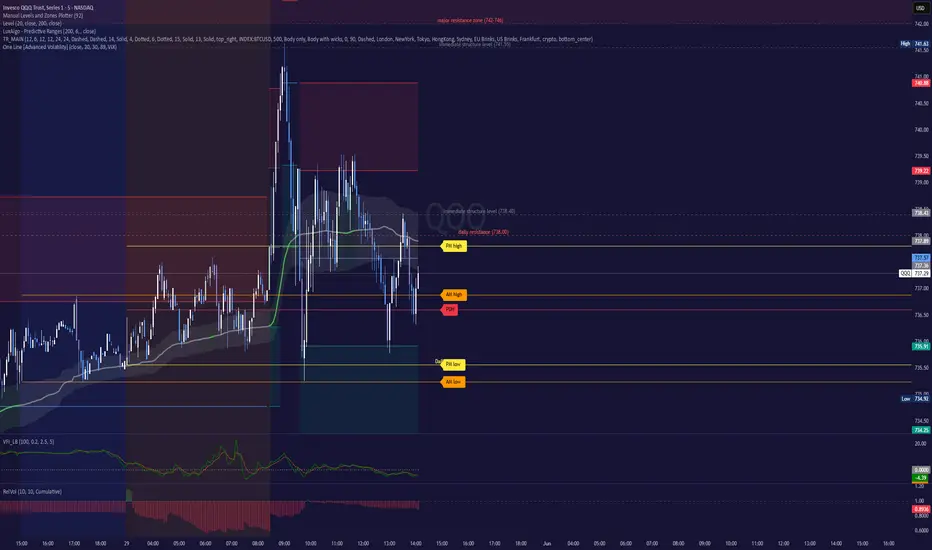
Most retail indicators fail because they ask a single, one-dimensional question: What is the price doing?
The One Line is a multi-factor state machine designed to filter out the noise that traps retail traders. Instead of relying on lagging moving averages, it requires the mathematical confluence of price expansion, directional money flow, higher-timeframe alignment, and implied volatility (VIX) to validate a trend. If the institutional data does not support the move, the indicator stays flat, keeping you out of the chop.
Core Mechanics
Under the hood, this script processes four institutional data pillars into a single, easy-to-read baseline:
How to Read the Chart
The indicator operates in three distinct regimes, represented by the color of the baseline and the surrounding volatility cloud (fueled by an exponentially smoothed ATR).
Trading Playbook & Best Practices
Trade the regime, not the noise.
The One Line is a multi-factor state machine designed to filter out the noise that traps retail traders. Instead of relying on lagging moving averages, it requires the mathematical confluence of price expansion, directional money flow, higher-timeframe alignment, and implied volatility (VIX) to validate a trend. If the institutional data does not support the move, the indicator stays flat, keeping you out of the chop.
Core Mechanics
Under the hood, this script processes four institutional data pillars into a single, easy-to-read baseline:
- Adaptive Efficiency Smoothing (KAMA): The baseline blends a VWMA and SMA, dynamically adjusted by Kaufman’s Efficiency Ratio (ER). During strong trends, the line tracks price closely. When the market turns into a noisy, inefficient mess, the alpha drops and the line goes completely flat.
- Directional Volume Flow (VFI): Rather than using raw volume—which can be easily skewed by a single block trade—the model calculates a Volume Flow Indicator (VFI). It caps anomalous volume spikes and tracks whether the underlying money flow is actually accumulating or distributing.
- Macro IV Filter (VIX): Equities do not move in a vacuum. The model continuously pulls real-time VIX data. A bullish breakout will only trigger if the VIX is in a state of crush (falling), and a bearish breakdown requires the VIX to be expanding.
- Non-Repainting MTF Trend: A strict, non-repainting higher-timeframe filter ensures you are never taking intraday signals against the macro structural trend.
How to Read the Chart
The indicator operates in three distinct regimes, represented by the color of the baseline and the surrounding volatility cloud (fueled by an exponentially smoothed ATR).
- Green (Bullish Regime): Price has broken above the upper volatility band, VFI shows net accumulation, the higher-timeframe trend is up, and the VIX is cooperating. Action: Look for long entries on pullbacks to the baseline.
- Red (Bearish Regime): Price has broken below the lower volatility band, VFI shows net distribution, the higher-timeframe trend is down, and the VIX is expanding. Action: Look for short entries or put options.
- Gray (Chop / Trap Zone): The market is mathematically inefficient. This triggers when price reverts inside the bands, volume dries up, or a structural divergence occurs (e.g., price is rising but VFI money flow suddenly turns negative). Action: Capital preservation. Sit on your hands.
Trading Playbook & Best Practices
- The "Trap" Exit: The smartest feature of this indicator is its dynamic reversion. If you are in a valid Green trend, but the underlying money flow (VFI) suddenly flips negative, the line will instantly turn Gray. Do not wait for price to hit your stop-loss. If the line turns gray, the institutional support for the move has vanished. Exit or trim your position.
- Asset Class: This model was built specifically for highly liquid, volume-heavy instruments like SPY, QQQ, and ES/NQ futures.
- Timeframes: It thrives on the 3-minute, 5-minute, and 15-minute charts. (Ensure the "Macro Timeframe" input is set appropriately higher than your chart timeframe, e.g., a 30m MTF on a 5m chart).
Trade the regime, not the noise.
開源腳本
秉持TradingView一貫精神,這個腳本的創作者將其設為開源,以便交易者檢視並驗證其功能。向作者致敬!您可以免費使用此腳本,但請注意,重新發佈代碼需遵守我們的社群規範。

免責聲明
這些資訊和出版物並非旨在提供,也不構成TradingView提供或認可的任何形式的財務、投資、交易或其他類型的建議或推薦。請閱讀使用條款以了解更多資訊。
開源腳本
秉持TradingView一貫精神,這個腳本的創作者將其設為開源,以便交易者檢視並驗證其功能。向作者致敬!您可以免費使用此腳本,但請注意,重新發佈代碼需遵守我們的社群規範。
免責聲明
這些資訊和出版物並非旨在提供,也不構成TradingView提供或認可的任何形式的財務、投資、交易或其他類型的建議或推薦。請閱讀使用條款以了解更多資訊。