OPEN-SOURCE SCRIPT
CandelaCharts - HTF Footprint Candles
📝 Overview
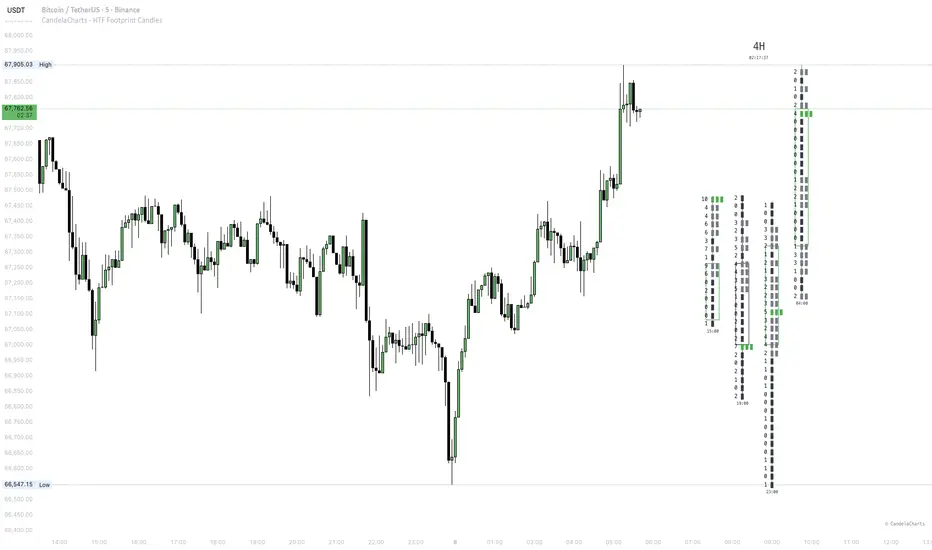
The CandelaCharts - HTF Footprint Candles is a professional-grade visualization tool that overlays High-Timeframe (HTF) candles onto your current chart while integrating a volume footprint profile. This gives traders the ability to analyze structural behavior and internal volume distribution of institutional candles without switching timeframes.
📦 Features
⚙️ Settings
🕒 Timeframe Control (Hierarchical Logic)
To ensure the drawings display correctly, you must understand the relationship between the three timeframes involved:
📊 LOT (Bin Size) Control
The Lot setting (found in the HTF I group) controls the vertical resolution of the footprint.
⚡️ Showcase
💎 Footprint Mode Presets
Point of Control (POC): Highlights the single price level with the highest volume (Label count). Essential for spotting where the most trading activity occurred.

Delta: Displays net buyer vs seller pressure at each level. Positive delta shows buying aggression; negative delta shows selling aggression.

Total Volume: Visualizes the total activity at each price point, regardless of direction. Great for identifying high-activity ranges.

POC + Voids: A hybrid mode that shows both high-volume interest (POC) and low-volume gaps.

Voids: Specifically filters for "liquidity gaps"—price levels that the bar moved through so quickly that very little volume was transacted.

🚨 Alerts
The indicator includes on-chart warnings if your Timeframe settings are incompatible (e.g., Chart TF < LTF).
⚠️ Disclaimer
Trading involves significant risk, and many participants may incur losses. The content on this site is not intended as financial advice and should not be interpreted as such. Decisions to buy, sell, hold, or trade securities, commodities, or other financial instruments carry inherent risks and are best made with guidance from qualified financial professionals. Past performance is not indicative of future results.
The CandelaCharts - HTF Footprint Candles is a professional-grade visualization tool that overlays High-Timeframe (HTF) candles onto your current chart while integrating a volume footprint profile. This gives traders the ability to analyze structural behavior and internal volume distribution of institutional candles without switching timeframes.
📦 Features
- Multi-HTF Visualization: Display up to 60 historical HTF candles as ghost overlays on the active chart.
- Volume Footprint Integration: Sourced from a Lower Timeframe (LTF) using request.security_lower_tf for granular precision.
- Multiple Footprint Modes:
- POC + Voids: Highlights the Point of Control and areas of low volume.
- Delta: Visualizes net buying vs selling pressure.
- Total Volume: Relative volume intensity at each price level.
- Voids: Specifically targets "gap" areas in price action. - New York Midnight Anchor: Option to anchor HTF candles to the NY 00:00 open for consistent institutional session analysis.
- Dynamic Labels: Auto-updating labels for HTF period, remaining time until candle close, and candle timestamps.
⚙️ Settings
🕒 Timeframe Control (Hierarchical Logic)
To ensure the drawings display correctly, you must understand the relationship between the three timeframes involved:
- HTF (Higher Timeframe): This is the timeframe of the "Ghost Candles" (e.g., 4H, Daily). It must be higher than your chart period.
- Chart Timeframe: The timeframe you are currently looking at.
- LTF (Lower Timeframe): Found in the HTF I group as "LTF". This is the source for the footprint calculation.
- 💡 Crucial Note: Your Chart Timeframe must be equal to or higher than the LTF setting. If you view a 1m chart but have LTF set to 5m, the footprint cannot be calculated.
📊 LOT (Bin Size) Control
The Lot setting (found in the HTF I group) controls the vertical resolution of the footprint.
- Definition: It represents the percentage of price movement that defines a single footprint "bin" or level.
- Configuration:
- Volatile Assets (e.g., BTC/NVDA): Use a higher Lot value (e.g., 0.05 or 0.1) to avoid creating too many bins.
- Stable Assets (e.g., EURUSD/Stablecoins): Use a lower Lot value (e.g., 0.005 or 0.01) for more granularity.
- ⚠️ Warning: Setting the Lot too small on a highly volatile asset can exceed TradingView's label limits, causing footprints to disappear or "evict" other chart annotations.
⚡️ Showcase
💎 Footprint Mode Presets
Point of Control (POC): Highlights the single price level with the highest volume (Label count). Essential for spotting where the most trading activity occurred.
Delta: Displays net buyer vs seller pressure at each level. Positive delta shows buying aggression; negative delta shows selling aggression.
Total Volume: Visualizes the total activity at each price point, regardless of direction. Great for identifying high-activity ranges.
POC + Voids: A hybrid mode that shows both high-volume interest (POC) and low-volume gaps.
Voids: Specifically filters for "liquidity gaps"—price levels that the bar moved through so quickly that very little volume was transacted.
🚨 Alerts
The indicator includes on-chart warnings if your Timeframe settings are incompatible (e.g., Chart TF < LTF).
⚠️ Disclaimer
Trading involves significant risk, and many participants may incur losses. The content on this site is not intended as financial advice and should not be interpreted as such. Decisions to buy, sell, hold, or trade securities, commodities, or other financial instruments carry inherent risks and are best made with guidance from qualified financial professionals. Past performance is not indicative of future results.
開源腳本
秉持TradingView一貫精神,這個腳本的創作者將其設為開源,以便交易者檢視並驗證其功能。向作者致敬!您可以免費使用此腳本,但請注意,重新發佈代碼需遵守我們的社群規範。

🔵 Tools that give you the edge: candelacharts.com/.
🔵 Join our free discord for updates: candelacharts.com/community
🔵 Join our free discord for updates: candelacharts.com/community
免責聲明
這些資訊和出版物並非旨在提供,也不構成TradingView提供或認可的任何形式的財務、投資、交易或其他類型的建議或推薦。請閱讀使用條款以了解更多資訊。
開源腳本
秉持TradingView一貫精神,這個腳本的創作者將其設為開源,以便交易者檢視並驗證其功能。向作者致敬!您可以免費使用此腳本,但請注意,重新發佈代碼需遵守我們的社群規範。
🔵 Tools that give you the edge: candelacharts.com/.
🔵 Join our free discord for updates: candelacharts.com/community
🔵 Join our free discord for updates: candelacharts.com/community
免責聲明
這些資訊和出版物並非旨在提供,也不構成TradingView提供或認可的任何形式的財務、投資、交易或其他類型的建議或推薦。請閱讀使用條款以了解更多資訊。