OPEN-SOURCE SCRIPT
已更新 RSI Extreme Divergence
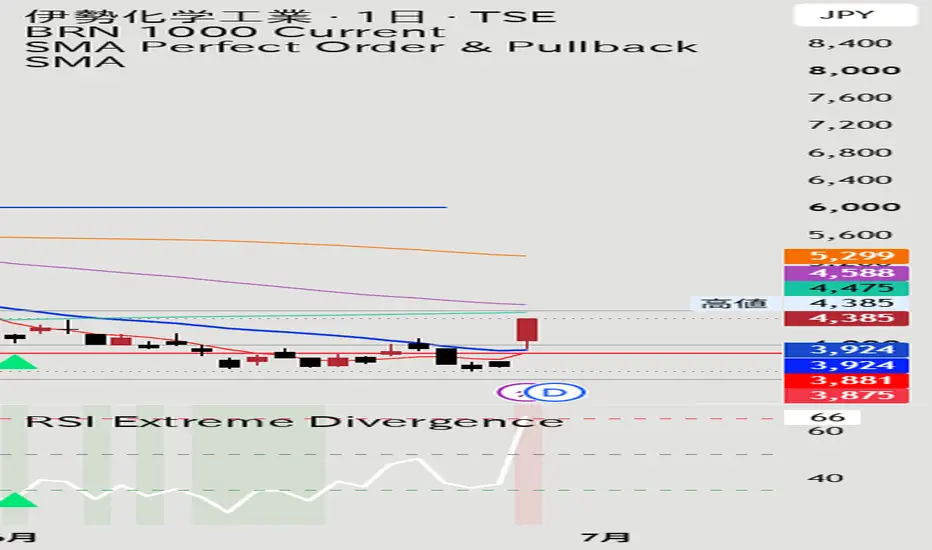
# RSI Extreme Divergence
An RSI divergence indicator designed to highlight only high-probability reversal signals.
Unlike standard divergence indicators, this script only detects divergences when the RSI reaches extreme conditions, helping filter out weaker signals during normal market fluctuations.
## Features
* Displays **RSI** with customizable length.
* Highlights **Overbought** and **Oversold** zones.
* Detects **Bullish Divergence** only when RSI is below the Oversold level.
* Detects **Bearish Divergence** only when RSI is above the Overbought level.
* Draws divergence lines directly on the RSI.
* Displays buy and sell arrows on both the RSI panel and the price chart.
* Includes alert support for bullish and bearish divergence signals.
## Why use this indicator?
Many divergence indicators generate too many signals during ranging markets.
This indicator focuses only on divergences that occur in extreme RSI conditions (default: above 70 or below 30), helping traders concentrate on higher-quality reversal opportunities.
## Default Settings
* RSI Length: **9**
* Pivot Length: **5**
* Overbought: **70**
* Oversold: **30**
These settings are optimized for swing trading but can be adjusted to suit different markets and trading styles.
An RSI divergence indicator designed to highlight only high-probability reversal signals.
Unlike standard divergence indicators, this script only detects divergences when the RSI reaches extreme conditions, helping filter out weaker signals during normal market fluctuations.
## Features
* Displays **RSI** with customizable length.
* Highlights **Overbought** and **Oversold** zones.
* Detects **Bullish Divergence** only when RSI is below the Oversold level.
* Detects **Bearish Divergence** only when RSI is above the Overbought level.
* Draws divergence lines directly on the RSI.
* Displays buy and sell arrows on both the RSI panel and the price chart.
* Includes alert support for bullish and bearish divergence signals.
## Why use this indicator?
Many divergence indicators generate too many signals during ranging markets.
This indicator focuses only on divergences that occur in extreme RSI conditions (default: above 70 or below 30), helping traders concentrate on higher-quality reversal opportunities.
## Default Settings
* RSI Length: **9**
* Pivot Length: **5**
* Overbought: **70**
* Oversold: **30**
These settings are optimized for swing trading but can be adjusted to suit different markets and trading styles.
發行說明
Default settings (65/35) are optimized for Japanese stocks and swing trading. Users can freely adjust these levels to match their trading style and market conditions.開源腳本
秉持TradingView一貫精神,這個腳本的創作者將其設為開源,以便交易者檢視並驗證其功能。向作者致敬!您可以免費使用此腳本,但請注意,重新發佈代碼需遵守我們的社群規範。

免責聲明
這些資訊和出版物並非旨在提供,也不構成TradingView提供或認可的任何形式的財務、投資、交易或其他類型的建議或推薦。請閱讀使用條款以了解更多資訊。
開源腳本
秉持TradingView一貫精神,這個腳本的創作者將其設為開源,以便交易者檢視並驗證其功能。向作者致敬!您可以免費使用此腳本,但請注意,重新發佈代碼需遵守我們的社群規範。
免責聲明
這些資訊和出版物並非旨在提供,也不構成TradingView提供或認可的任何形式的財務、投資、交易或其他類型的建議或推薦。請閱讀使用條款以了解更多資訊。