OPEN-SOURCE SCRIPT
已更新 Syawal Vertical Lines
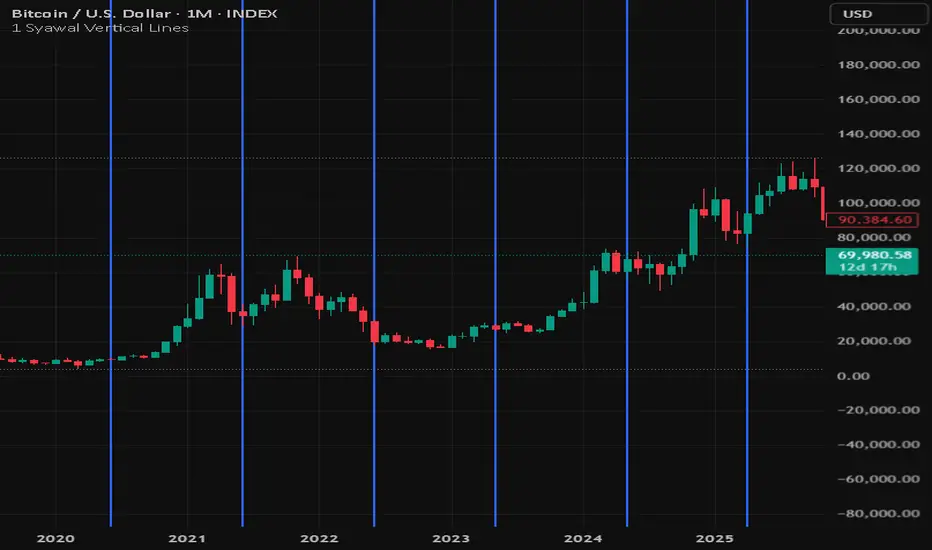
Indicator Description
1 Shawwal Vertical Lines – Eid Mubarak Edition marks the date of 1 Shawwal (Eid al-Fitr) on the chart with vertical blue lines. Each line represents the day when Muslims around the world celebrate Eid Mubarak, the festival marking the end of Ramadan.
The dates are based on the conversion of the Islamic Hijri calendar to the Gregorian calendar for the period 2006–2025.
This indicator is designed to help traders and analysts explore potential seasonality and event-driven patterns in the market around major cultural and economic moments. Eid al-Fitr is often associated with shifts in economic activity, including:
- increased consumer spending
- changes in liquidity and market participation
- regional variations in trading behavior
By marking these dates directly on the chart, users can easily:
- identify where Eid al-Fitr occurs within market cycles
- compare market reactions across different years
- study potential holiday-related market behavior
The indicator works on all timeframes because it uses timestamp-based detection, ensuring the vertical lines appear correctly on daily, weekly, and monthly charts.
Features
- Vertical markers for 1 Shawwal (2006–2025)
- Works on all timeframes
- Useful for seasonality and event-based analysis
- Lightweight and does not rely on technical calculations
Note
The exact date of Eid al-Fitr may vary slightly between countries due to different lunar observation methods. The dates used in this indicator follow commonly accepted Hijri-to-Gregorian calendar conversions.
Eid Mubarak to everyone celebrating.
1 Shawwal Vertical Lines – Eid Mubarak Edition marks the date of 1 Shawwal (Eid al-Fitr) on the chart with vertical blue lines. Each line represents the day when Muslims around the world celebrate Eid Mubarak, the festival marking the end of Ramadan.
The dates are based on the conversion of the Islamic Hijri calendar to the Gregorian calendar for the period 2006–2025.
This indicator is designed to help traders and analysts explore potential seasonality and event-driven patterns in the market around major cultural and economic moments. Eid al-Fitr is often associated with shifts in economic activity, including:
- increased consumer spending
- changes in liquidity and market participation
- regional variations in trading behavior
By marking these dates directly on the chart, users can easily:
- identify where Eid al-Fitr occurs within market cycles
- compare market reactions across different years
- study potential holiday-related market behavior
The indicator works on all timeframes because it uses timestamp-based detection, ensuring the vertical lines appear correctly on daily, weekly, and monthly charts.
Features
- Vertical markers for 1 Shawwal (2006–2025)
- Works on all timeframes
- Useful for seasonality and event-based analysis
- Lightweight and does not rely on technical calculations
Note
The exact date of Eid al-Fitr may vary slightly between countries due to different lunar observation methods. The dates used in this indicator follow commonly accepted Hijri-to-Gregorian calendar conversions.
Eid Mubarak to everyone celebrating.
發行說明
add/edit data for year 2026開源腳本
秉持TradingView一貫精神,這個腳本的創作者將其設為開源,以便交易者檢視並驗證其功能。向作者致敬!您可以免費使用此腳本,但請注意,重新發佈代碼需遵守我們的社群規範。

免責聲明
這些資訊和出版物並非旨在提供,也不構成TradingView提供或認可的任何形式的財務、投資、交易或其他類型的建議或推薦。請閱讀使用條款以了解更多資訊。
開源腳本
秉持TradingView一貫精神,這個腳本的創作者將其設為開源,以便交易者檢視並驗證其功能。向作者致敬!您可以免費使用此腳本,但請注意,重新發佈代碼需遵守我們的社群規範。
免責聲明
這些資訊和出版物並非旨在提供,也不構成TradingView提供或認可的任何形式的財務、投資、交易或其他類型的建議或推薦。請閱讀使用條款以了解更多資訊。