已更新
[blackcat] L2 Trend Guard Oscillator
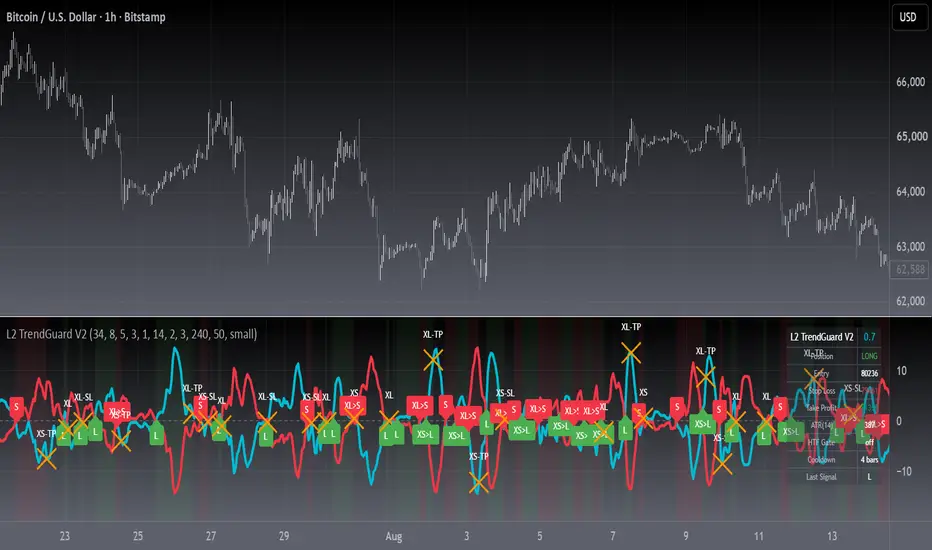
OVERVIEW
📊 The L2 Trend Guard Oscillator is a comprehensive technical analysis framework designed specifically to identify market trend reversals using adaptive filtering algorithms that combine price action dynamics with statistical measures of volatility and momentum.
Key Purpose:
Generate reliable early warning signals before major trend changes occur
Provide clear directional bias indicators aligned with institutional investor behavior patterns
Offer risk-managed entry/exit opportunities suitable for various timeframes
TECHNICAL FOUNDATION EXPLAINED
🎓 Core Mechanism Breakdown:
[Custom Weighted Moving Average Function:]
→ Advanced smoothing technique emphasizing recent data points more heavily than older ones
↓ Reduces lag while maintaining signal integrity compared to traditional MA approaches
[Primary Calculation Layers:]
• Short-term Momentum Assessment:
🔶 Relative strength between closing prices vs lower bounds
• Long-term Directional Bias Analysis:
📈 Extended timeframe comparison generating structural context
• Defense Level Generation:
➜ Protective boundary calculation incorporating EMAs for stability enhancement
PARAMETER CONFIGURATION GUIDE
🔧 Adjustable Settings Explained In Detail:
[yellow]Timeframe Selection:**
↔ Controls lookback period sensitivity affecting responsiveness
↕ Adjusts reaction speed vs accuracy trade-off dynamically
[purple]Weight Factor Specification:**
⚡ Influences emphasis on newer versus historical observations
🎯 Defines key decision-making thresholds clearly
ALGORITHM EXECUTION FLOW
💻 Processing Sequence Overview:
[Data Collection & Preprocessing]:
→ Gather raw pricing inputs across required periods
↓ Normalize values preparing them for subsequent processing stages
[Momentum Derivation Phase]:
✔ Calculate relative strength positions against established ranges
❌ Filter outliers maintaining signal integrity consistently
[Signal Enhancement Pipeline:]
⟶ Apply dual-pass filtering reducing false signals effectively
➡ Generate actionable trading opportunities systematically
VISUALIZATION ARCHITECTURE
🎨 Display Elements Designated Purpose:
🔵 Primary Indicator Traces:
→ Aqua Trace: Buy/Sell Signal Progression
↑ Red Line: Opposing Force Boundary
🟥 Gray Dashed: Zero Reference Point
🏷️ Label System For Critical Events:
✅ BUY: Bullish Opportunity Markers
❌ SELL: Bearish Setup Validations
STRATEGIC IMPLEMENTATION FRAMEWORK
📋 Practical Deployment Steps:
Initial Integration Protocol:
• Select appropriate timeframe matching strategy objectives
• Configure input parameters aligning with target asset behavior traits
• Conduct thorough backtesting under simulated environments initially
Active Monitoring Procedures:
→ Regular observation of labeled event placements versus actual movements
↓ Track confirmation patterns leading up to signaled opportunities carefully
↑ Evaluate overall framework reliability across different regime types regularly
Execution Guidelines Formulation:
✔ Enter positions only after achieving minimum number of confirming inputs
❌ Avoid isolated occurrences lacking adequate supporting evidence always
➞ Look for convergent factors strengthening conviction before acting decisively
PERFORMANCE OPTIMIZATION TECHNIQUES
🚀 Continuous Improvement Strategies:
Parameter Calibration Approach:
✓ Start testing default suggested configurations thoroughly
↕ Gradually adjust individual components observing outcome changes methodically
✨ Document findings building personalized version profile incrementally
Context Adaptability Methods:
🔄 Add supplementary indicators enhancing overall reliability when needed
🔧 Remove unnecessary complexity layers avoiding confusion/distracted decisions
💫 Incorporate custom rules adapting specific security behaviors effectively
Efficiency Improvement Tactics:
⚙️ Streamline redundant computational routines wherever possible efficiently
♻️ Leverage shared data streams minimizing resource utilization significantly
⏳ Optimize refresh frequencies balancing update speed vs overhead properly
📊 The L2 Trend Guard Oscillator is a comprehensive technical analysis framework designed specifically to identify market trend reversals using adaptive filtering algorithms that combine price action dynamics with statistical measures of volatility and momentum.
Key Purpose:
Generate reliable early warning signals before major trend changes occur
Provide clear directional bias indicators aligned with institutional investor behavior patterns
Offer risk-managed entry/exit opportunities suitable for various timeframes
TECHNICAL FOUNDATION EXPLAINED
🎓 Core Mechanism Breakdown:
[Custom Weighted Moving Average Function:]
→ Advanced smoothing technique emphasizing recent data points more heavily than older ones
↓ Reduces lag while maintaining signal integrity compared to traditional MA approaches
[Primary Calculation Layers:]
• Short-term Momentum Assessment:
🔶 Relative strength between closing prices vs lower bounds
• Long-term Directional Bias Analysis:
📈 Extended timeframe comparison generating structural context
• Defense Level Generation:
➜ Protective boundary calculation incorporating EMAs for stability enhancement
PARAMETER CONFIGURATION GUIDE
🔧 Adjustable Settings Explained In Detail:
[yellow]Timeframe Selection:**
↔ Controls lookback period sensitivity affecting responsiveness
↕ Adjusts reaction speed vs accuracy trade-off dynamically
[purple]Weight Factor Specification:**
⚡ Influences emphasis on newer versus historical observations
🎯 Defines key decision-making thresholds clearly
ALGORITHM EXECUTION FLOW
💻 Processing Sequence Overview:
[Data Collection & Preprocessing]:
→ Gather raw pricing inputs across required periods
↓ Normalize values preparing them for subsequent processing stages
[Momentum Derivation Phase]:
✔ Calculate relative strength positions against established ranges
❌ Filter outliers maintaining signal integrity consistently
[Signal Enhancement Pipeline:]
⟶ Apply dual-pass filtering reducing false signals effectively
➡ Generate actionable trading opportunities systematically
VISUALIZATION ARCHITECTURE
🎨 Display Elements Designated Purpose:
🔵 Primary Indicator Traces:
→ Aqua Trace: Buy/Sell Signal Progression
↑ Red Line: Opposing Force Boundary
🟥 Gray Dashed: Zero Reference Point
🏷️ Label System For Critical Events:
✅ BUY: Bullish Opportunity Markers
❌ SELL: Bearish Setup Validations
STRATEGIC IMPLEMENTATION FRAMEWORK
📋 Practical Deployment Steps:
Initial Integration Protocol:
• Select appropriate timeframe matching strategy objectives
• Configure input parameters aligning with target asset behavior traits
• Conduct thorough backtesting under simulated environments initially
Active Monitoring Procedures:
→ Regular observation of labeled event placements versus actual movements
↓ Track confirmation patterns leading up to signaled opportunities carefully
↑ Evaluate overall framework reliability across different regime types regularly
Execution Guidelines Formulation:
✔ Enter positions only after achieving minimum number of confirming inputs
❌ Avoid isolated occurrences lacking adequate supporting evidence always
➞ Look for convergent factors strengthening conviction before acting decisively
PERFORMANCE OPTIMIZATION TECHNIQUES
🚀 Continuous Improvement Strategies:
Parameter Calibration Approach:
✓ Start testing default suggested configurations thoroughly
↕ Gradually adjust individual components observing outcome changes methodically
✨ Document findings building personalized version profile incrementally
Context Adaptability Methods:
🔄 Add supplementary indicators enhancing overall reliability when needed
🔧 Remove unnecessary complexity layers avoiding confusion/distracted decisions
💫 Incorporate custom rules adapting specific security behaviors effectively
Efficiency Improvement Tactics:
⚙️ Streamline redundant computational routines wherever possible efficiently
♻️ Leverage shared data streams minimizing resource utilization significantly
⏳ Optimize refresh frequencies balancing update speed vs overhead properly
發行說明
█ OVERVIEWL2 Trend Guard Oscillator turns a normalized price-position reading into a clean
zero-line momentum oscillator that flags long and short pressure on any symbol and
timeframe. Every signal is state-aware, so entries, exits and ATR-based protective
levels stay consistent instead of flickering bar after bar.
█ CONCEPTS
The oscillator answers one question: is price being pushed up or down relative to its
own recent range?
• Defense line — typical price measured against the recent high-low range and
smoothed with a slow EMA; the trend guard.
• Trigger line — a faster EMA of the defense line.
• Oscillator — defense minus trigger. Above zero = short-term pressure building,
below zero = fading.
Zero-line crossings are the raw signals. The red mirror line is the negative of the
oscillator: it only makes the up/down symmetry readable at a glance.
█ HOW TO USE
1 — Add the script to any chart. It opens in its own pane with a dashed zero line and
never rescales your price chart.
2 — Rising above zero = long pressure, falling below zero = short pressure.
3 — Trade the labels, not the wiggles:
• L (green, up) long entry, S (red, down) short entry
• XL / XS (orange cross) closed by the opposite signal
• XL-TP / XS-TP or XL-SL / XS-SL closed by the ATR target or stop
• XL>S / XS>L flip: closed and reversed on the same bar
4 — The dashboard shows position, entry, stop, target, ATR, MTF gate and cooldown.
5 — Right-click the chart to create an alert; five conditions are exposed.
█ INPUT PARAMETERS
Signal Engine
• Defense Base Lookback (34) — range window used to normalize price.
• Defense EMA (8) / Trigger EMA (5) — smoothing; smaller values flip faster.
Signal Governance
• State Machine + Exclusivity — blocks duplicate and same-bar contradictory signals;
off returns the raw, unfiltered behaviour.
• Cooldown Bars (3) — minimum bars between two signals, 0 disables it.
• V1 Zero-Zone Sell (off) / Zero-Zone Width (1.0) — optional legacy sell while the
oscillator sits just above zero on a down bar; noisy in ranges.
Risk and Filters
• Enable ATR TP/SL (on), ATR Length (14), Stop Loss x ATR (2.0), Take Profit x ATR (3.0).
• Enable HTF Trend Gate (off), HTF Timeframe (240), HTF EMA Length (50) — longs only
above that EMA, shorts only below it; must be higher than the chart timeframe.
• Show Labels, Show Background, Show Dashboard, Label Size, Enable Alert Conditions.
█ SIGNALS
• L / S entries, XL / XS exits, XL-TP / XL-SL and
XS-TP / XS-SL ATR exits, XL>S / XS>L flips.
• A light green or light red background marks the open position.
• The data window exposes defense line, trigger line, position state, stop and target.
█ IMPLEMENTATION NOTES
• EMA smoothing, range normalization and ATR; signals come from zero-line crossings,
not level comparisons.
• The optional higher-timeframe gate reads the previous closed bar with lookahead on,
so it does not repaint.
• Signals and alerts are confirmed on bar close.
█ LIMITATIONS
• Momentum lags by design: the first leg of a sharp reversal is missed.
• Ranges still produce zero-line whipsaws; raise Cooldown Bars or keep the MTF gate on.
• ATR exits are evaluated on bar highs and lows, so labels mark the touch bar, not a
fill price.
• Best on liquid symbols, 5-minute timeframes and above.
█ NOTES
• Defaults reproduce the original blackcat L2 engine; every filter is optional.
• A signal and risk-mapping tool, not a standalone trading system.
════════════════════════════════════════════════════════════════════════
For questions or feedback, please use the comments section below.
Feel free to use and modify — attribution appreciated.

Don't miss out! The first and most important thing to do is to join my Discord chat now! Click here to start your adventure: discord.com/invite/ZTGpQJq My new github for more pine development soon: github.com/wxt-coder
免責聲明
這些資訊和出版物並非旨在提供,也不構成TradingView提供或認可的任何形式的財務、投資、交易或其他類型的建議或推薦。請閱讀使用條款以了解更多資訊。
Don't miss out! The first and most important thing to do is to join my Discord chat now! Click here to start your adventure: discord.com/invite/ZTGpQJq My new github for more pine development soon: github.com/wxt-coder
免責聲明
這些資訊和出版物並非旨在提供,也不構成TradingView提供或認可的任何形式的財務、投資、交易或其他類型的建議或推薦。請閱讀使用條款以了解更多資訊。