OPEN-SOURCE SCRIPT
已更新 Funding Carry Stress Map [AGPro Series]
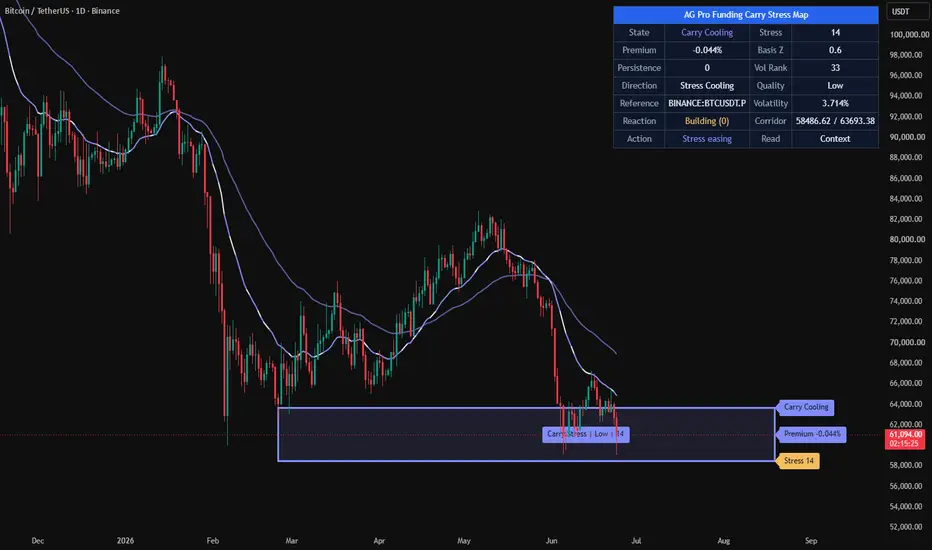
Funding Carry Stress Map [AGPro Series]
🧠 Core Idea
Is the market carrying a hidden derivatives premium or discount that is becoming crowded enough to matter?
📌 Overview / What it does
Funding Carry Stress Map is a crypto derivatives context tool designed to estimate when perpetual-style premium, carry pressure, basis drift, and volatility-adjusted crowding are becoming structurally relevant on the chart.
The script compares the active chart symbol against a user-selected spot reference, builds a smoothed carry baseline, measures premium/discount deviation, evaluates persistence, and converts the result into a visual carry stress framework. It produces a projected carry stress corridor, state labels, right-side tags, alerts, and a compact AG Pro dashboard.
It does not read official exchange funding payments, automate trades, predict future price direction, or promise that elevated carry stress must reverse. It is a structured analytical layer for reading derivatives pressure, premium imbalance, discount imbalance, carry squeeze risk, and cooling behavior.
🎯 Purpose & Design Philosophy
This script was built to fill a gap in the public AGProLabs lineup: most chart tools focus on trend, volume, support/resistance, momentum, or volatility. Crypto traders also need a clean way to think about derivatives-side pressure without turning the chart into a noisy data terminal.
The design goal is to make carry stress visible as a chart story. Instead of showing only a raw spread number, the script asks whether premium/discount is large, unusual, persistent, and supported by enough volatility context to deserve attention.
It is built for traders who want to monitor crowded long carry, crowded short carry, squeeze risk, and stress cooling while still making their own decisions from broader market context.
⚡ Why This Script Is Different
Most tools either show generic premium/basis values or treat funding-related pressure as a simple bullish/bearish signal.
This script does NOT claim to know the next candle, does NOT treat carry pressure as an automatic reversal signal, and does NOT depend on official funding-rate feeds that may not be available on every chart.
Instead, it converts spot-vs-active-symbol premium behavior into a structured carry stress map: premium size, normalized basis deviation, persistence, volatility rank, price reaction, and cooling behavior are combined into one visual decision-support framework.
⚙️ Methodology
1. Context Detection
The script reads the active chart price and a spot reference. By default, it automatically builds that reference from the chart base currency, selected exchange, and selected quote.
2. Reference Mapping
The premium series is smoothed into a carry baseline. The script then measures how far current premium/discount has moved away from that baseline.
3. Reaction Evaluation
The model evaluates basis z-score, absolute premium percentage, persistence across a recent window, volatility rank, and whether price is starting to reject the crowded side.
4. Visual Output
The result is displayed as a carry stress corridor, event labels, right-side tags, and a dashboard panel showing state, stress score, premium, basis z-score, persistence, volatility rank, and current interpretation.
🗺️ How to Read the Chart
The carry stress corridor represents the active price area where derivatives-side pressure is being monitored.
Labels mark important state transitions such as premium stress, discount stress, carry squeeze risk, and carry cooling.
Colors communicate state:
• Pink = positive carry / long-crowding stress
• Teal = negative carry / short-crowding stress
• Yellow = squeeze-risk reaction
• Indigo = cooling or neutralization
The panel summarizes the current condition so the user can quickly read whether carry pressure is low, watch-level, elevated, or extreme.
🚦 Signals & States
• Premium Stress → positive premium/carry pressure is active and persistent enough to monitor
• Discount Stress → negative premium/discount pressure is active and persistent enough to monitor
• Carry Squeeze Risk → elevated carry pressure is present while price begins reacting against the crowded side
• Carry Cooling → previously meaningful carry stress has faded below the model’s cooling zone
• Reset → no active carry imbalance is strong enough to dominate the current read
🔔 Alerts Logic
Alerts trigger when the internal state changes into one of the selected alert conditions.
Premium Stress alerts mark a transition into meaningful positive carry pressure.
Discount Stress alerts mark a transition into meaningful negative carry pressure.
Carry Squeeze Risk alerts mark a transition where crowded carry pressure and adverse price reaction align.
Carry Cooling alerts mark a transition where carry stress has materially faded.
Alerts are attention markers, not trade instructions.
🧩 Confluence Logic
The strongest context appears when multiple components align:
When premium size + basis z-score + persistence + volatility rank align, the carry stress score becomes more meaningful.
When that elevated score also appears with price rejection against the crowded side, the context shifts from simple premium/discount monitoring into potential squeeze-risk awareness.
📊 When to Use
• Crypto perpetual and futures markets where a spot reference can be selected
• Perpetual charts compared against their closest spot market
• High-interest crypto pairs where basis and carry pressure can influence behavior
• Volatile sessions where crowded positioning may matter more than usual
• Market regimes where traders want to monitor long-crowd or short-crowd pressure
⚠️ When NOT to Use
• Illiquid symbols with unreliable spot or futures pricing
• Charts where the selected spot reference is not comparable to the active symbol
• Markets with very noisy or fragmented data
• Extreme news events where spread behavior can become unstable
• Non-crypto symbols unless the user deliberately selects a meaningful reference
🎛️ Key Inputs
• Auto Spot Reference → automatically builds the spot reference from the chart base currency, selected exchange, and selected quote
• Carry Baseline Length → controls how quickly the premium baseline adapts
• Stress Normalization Lookback → controls how far back the script looks to judge unusual basis behavior
• Persistence Window → measures whether carry pressure persists across several bars
• Premium Stress Threshold % → defines the minimum premium/discount level required for active stress
• Reference Mismatch Guard % → prevents mismatched symbols from being interpreted as real carry stress
• Basis Z-Score Threshold → defines how unusual the spread must be before stress can activate
• Visual Settings → control corridor projection, labels, right-side tags, bar colors, and font sizes
🖥️ Interface & Visual Design
The interface is designed around a premium first-glance chart story.
The corridor gives the chart an active visual anchor. The centered label explains the current stress read without forcing the user to inspect every panel row. Right-side tags keep the current state visible near the active price area.
The panel uses the AG Pro layout standard with a blue merged header row, adjustable location, adjustable theme, and adjustable font size.
🧪 Practical Usage Workflow
1. Apply the script to a perpetual or futures chart.
2. Keep Auto Spot Reference enabled, or manually select the closest matching spot market.
3. Read the panel state and stress score.
4. Check whether the corridor is neutral, premium-stressed, discount-stressed, or showing squeeze risk.
5. Evaluate price reaction around the corridor together with broader market structure, volatility, and risk rules.
🔍 Interpretation Guidelines
Treat carry stress as a context layer.
Premium stress can mean long-side carry is becoming crowded, but it does not automatically mean price must fall.
Discount stress can mean short-side carry is becoming crowded, but it does not automatically mean price must rise.
Carry squeeze risk is stronger when elevated stress and adverse price reaction appear together, but it still requires confirmation from broader market context.
🚫 What This Script Is NOT
This script is not a prediction engine.
This script is not financial advice.
This script is not an auto trading system.
This script is not a guaranteed signal engine.
This script does not read official funding payment data directly.
This script does not claim that premium or discount must immediately mean-revert.
⚠️ Limitations & Transparency
The script estimates carry stress from active-symbol versus spot-reference behavior. It is a proxy framework, not an official exchange funding-rate feed.
Results can vary by exchange, symbol mapping, liquidity, timeframe, and data quality.
The selected reference must match the active market. Auto Spot Reference is enabled by default to help keep ETH charts on an ETH reference, BTC charts on a BTC reference, and similar mappings aligned.
Fast market moves, low liquidity, stale references, or mismatched symbol selections can affect the accuracy of the stress interpretation.
Market conditions change, and the same stress score may behave differently across different volatility regimes.
🧠 Market Context Notes
In crypto markets, derivatives pressure can matter because perpetual traders may become crowded on one side when premium, basis, and volatility remain elevated.
This does not create certainty. It creates context.
The value of the script is strongest when the user combines carry stress with structure, liquidity, trend quality, volatility, and disciplined risk management.
🧾 Use Case Examples
When price trades above the spot reference with persistent premium and the panel shifts into Premium Stress, the user may monitor whether long-side carry is becoming crowded.
When price trades below the spot reference with persistent discount and the panel shifts into Discount Stress, the user may monitor whether short-side pressure is becoming crowded.
When elevated carry stress appears and price starts rejecting the crowded side, the Carry Squeeze Risk state can help highlight a context worth closer attention.
🧱 System Philosophy
Funding Carry Stress Map follows the AGProLabs principle of building decision-support maps rather than prediction tools.
The script is designed to make hidden context easier to see, not to replace judgment.
Its purpose is to organize information into a cleaner visual workflow: read the state, inspect the corridor, evaluate reaction, and confirm with broader context.
🔐 Non-Promise Statement
No script can guarantee market direction.
No carry stress model can remove uncertainty.
This tool helps organize context; it does not create certainty.
📉 Risk Disclosure
Trading involves risk.
Crypto derivatives can be highly volatile and may involve leverage, liquidation risk, exchange risk, funding-cost changes, and rapid market movement.
This script is for educational and analytical purposes only.
It does not provide financial advice or guaranteed trading outcomes.
Users remain responsible for their own decisions.
📚 Educational Note
Use the script as a learning layer for understanding how premium, discount, persistence, volatility, and price reaction can combine into a more complete derivatives-pressure read.
🧠 Core Idea
Is the market carrying a hidden derivatives premium or discount that is becoming crowded enough to matter?
📌 Overview / What it does
Funding Carry Stress Map is a crypto derivatives context tool designed to estimate when perpetual-style premium, carry pressure, basis drift, and volatility-adjusted crowding are becoming structurally relevant on the chart.
The script compares the active chart symbol against a user-selected spot reference, builds a smoothed carry baseline, measures premium/discount deviation, evaluates persistence, and converts the result into a visual carry stress framework. It produces a projected carry stress corridor, state labels, right-side tags, alerts, and a compact AG Pro dashboard.
It does not read official exchange funding payments, automate trades, predict future price direction, or promise that elevated carry stress must reverse. It is a structured analytical layer for reading derivatives pressure, premium imbalance, discount imbalance, carry squeeze risk, and cooling behavior.
🎯 Purpose & Design Philosophy
This script was built to fill a gap in the public AGProLabs lineup: most chart tools focus on trend, volume, support/resistance, momentum, or volatility. Crypto traders also need a clean way to think about derivatives-side pressure without turning the chart into a noisy data terminal.
The design goal is to make carry stress visible as a chart story. Instead of showing only a raw spread number, the script asks whether premium/discount is large, unusual, persistent, and supported by enough volatility context to deserve attention.
It is built for traders who want to monitor crowded long carry, crowded short carry, squeeze risk, and stress cooling while still making their own decisions from broader market context.
⚡ Why This Script Is Different
Most tools either show generic premium/basis values or treat funding-related pressure as a simple bullish/bearish signal.
This script does NOT claim to know the next candle, does NOT treat carry pressure as an automatic reversal signal, and does NOT depend on official funding-rate feeds that may not be available on every chart.
Instead, it converts spot-vs-active-symbol premium behavior into a structured carry stress map: premium size, normalized basis deviation, persistence, volatility rank, price reaction, and cooling behavior are combined into one visual decision-support framework.
⚙️ Methodology
1. Context Detection
The script reads the active chart price and a spot reference. By default, it automatically builds that reference from the chart base currency, selected exchange, and selected quote.
2. Reference Mapping
The premium series is smoothed into a carry baseline. The script then measures how far current premium/discount has moved away from that baseline.
3. Reaction Evaluation
The model evaluates basis z-score, absolute premium percentage, persistence across a recent window, volatility rank, and whether price is starting to reject the crowded side.
4. Visual Output
The result is displayed as a carry stress corridor, event labels, right-side tags, and a dashboard panel showing state, stress score, premium, basis z-score, persistence, volatility rank, and current interpretation.
🗺️ How to Read the Chart
The carry stress corridor represents the active price area where derivatives-side pressure is being monitored.
Labels mark important state transitions such as premium stress, discount stress, carry squeeze risk, and carry cooling.
Colors communicate state:
• Pink = positive carry / long-crowding stress
• Teal = negative carry / short-crowding stress
• Yellow = squeeze-risk reaction
• Indigo = cooling or neutralization
The panel summarizes the current condition so the user can quickly read whether carry pressure is low, watch-level, elevated, or extreme.
🚦 Signals & States
• Premium Stress → positive premium/carry pressure is active and persistent enough to monitor
• Discount Stress → negative premium/discount pressure is active and persistent enough to monitor
• Carry Squeeze Risk → elevated carry pressure is present while price begins reacting against the crowded side
• Carry Cooling → previously meaningful carry stress has faded below the model’s cooling zone
• Reset → no active carry imbalance is strong enough to dominate the current read
🔔 Alerts Logic
Alerts trigger when the internal state changes into one of the selected alert conditions.
Premium Stress alerts mark a transition into meaningful positive carry pressure.
Discount Stress alerts mark a transition into meaningful negative carry pressure.
Carry Squeeze Risk alerts mark a transition where crowded carry pressure and adverse price reaction align.
Carry Cooling alerts mark a transition where carry stress has materially faded.
Alerts are attention markers, not trade instructions.
🧩 Confluence Logic
The strongest context appears when multiple components align:
When premium size + basis z-score + persistence + volatility rank align, the carry stress score becomes more meaningful.
When that elevated score also appears with price rejection against the crowded side, the context shifts from simple premium/discount monitoring into potential squeeze-risk awareness.
📊 When to Use
• Crypto perpetual and futures markets where a spot reference can be selected
• Perpetual charts compared against their closest spot market
• High-interest crypto pairs where basis and carry pressure can influence behavior
• Volatile sessions where crowded positioning may matter more than usual
• Market regimes where traders want to monitor long-crowd or short-crowd pressure
⚠️ When NOT to Use
• Illiquid symbols with unreliable spot or futures pricing
• Charts where the selected spot reference is not comparable to the active symbol
• Markets with very noisy or fragmented data
• Extreme news events where spread behavior can become unstable
• Non-crypto symbols unless the user deliberately selects a meaningful reference
🎛️ Key Inputs
• Auto Spot Reference → automatically builds the spot reference from the chart base currency, selected exchange, and selected quote
• Carry Baseline Length → controls how quickly the premium baseline adapts
• Stress Normalization Lookback → controls how far back the script looks to judge unusual basis behavior
• Persistence Window → measures whether carry pressure persists across several bars
• Premium Stress Threshold % → defines the minimum premium/discount level required for active stress
• Reference Mismatch Guard % → prevents mismatched symbols from being interpreted as real carry stress
• Basis Z-Score Threshold → defines how unusual the spread must be before stress can activate
• Visual Settings → control corridor projection, labels, right-side tags, bar colors, and font sizes
🖥️ Interface & Visual Design
The interface is designed around a premium first-glance chart story.
The corridor gives the chart an active visual anchor. The centered label explains the current stress read without forcing the user to inspect every panel row. Right-side tags keep the current state visible near the active price area.
The panel uses the AG Pro layout standard with a blue merged header row, adjustable location, adjustable theme, and adjustable font size.
🧪 Practical Usage Workflow
1. Apply the script to a perpetual or futures chart.
2. Keep Auto Spot Reference enabled, or manually select the closest matching spot market.
3. Read the panel state and stress score.
4. Check whether the corridor is neutral, premium-stressed, discount-stressed, or showing squeeze risk.
5. Evaluate price reaction around the corridor together with broader market structure, volatility, and risk rules.
🔍 Interpretation Guidelines
Treat carry stress as a context layer.
Premium stress can mean long-side carry is becoming crowded, but it does not automatically mean price must fall.
Discount stress can mean short-side carry is becoming crowded, but it does not automatically mean price must rise.
Carry squeeze risk is stronger when elevated stress and adverse price reaction appear together, but it still requires confirmation from broader market context.
🚫 What This Script Is NOT
This script is not a prediction engine.
This script is not financial advice.
This script is not an auto trading system.
This script is not a guaranteed signal engine.
This script does not read official funding payment data directly.
This script does not claim that premium or discount must immediately mean-revert.
⚠️ Limitations & Transparency
The script estimates carry stress from active-symbol versus spot-reference behavior. It is a proxy framework, not an official exchange funding-rate feed.
Results can vary by exchange, symbol mapping, liquidity, timeframe, and data quality.
The selected reference must match the active market. Auto Spot Reference is enabled by default to help keep ETH charts on an ETH reference, BTC charts on a BTC reference, and similar mappings aligned.
Fast market moves, low liquidity, stale references, or mismatched symbol selections can affect the accuracy of the stress interpretation.
Market conditions change, and the same stress score may behave differently across different volatility regimes.
🧠 Market Context Notes
In crypto markets, derivatives pressure can matter because perpetual traders may become crowded on one side when premium, basis, and volatility remain elevated.
This does not create certainty. It creates context.
The value of the script is strongest when the user combines carry stress with structure, liquidity, trend quality, volatility, and disciplined risk management.
🧾 Use Case Examples
When price trades above the spot reference with persistent premium and the panel shifts into Premium Stress, the user may monitor whether long-side carry is becoming crowded.
When price trades below the spot reference with persistent discount and the panel shifts into Discount Stress, the user may monitor whether short-side pressure is becoming crowded.
When elevated carry stress appears and price starts rejecting the crowded side, the Carry Squeeze Risk state can help highlight a context worth closer attention.
🧱 System Philosophy
Funding Carry Stress Map follows the AGProLabs principle of building decision-support maps rather than prediction tools.
The script is designed to make hidden context easier to see, not to replace judgment.
Its purpose is to organize information into a cleaner visual workflow: read the state, inspect the corridor, evaluate reaction, and confirm with broader context.
🔐 Non-Promise Statement
No script can guarantee market direction.
No carry stress model can remove uncertainty.
This tool helps organize context; it does not create certainty.
📉 Risk Disclosure
Trading involves risk.
Crypto derivatives can be highly volatile and may involve leverage, liquidation risk, exchange risk, funding-cost changes, and rapid market movement.
This script is for educational and analytical purposes only.
It does not provide financial advice or guaranteed trading outcomes.
Users remain responsible for their own decisions.
📚 Educational Note
Use the script as a learning layer for understanding how premium, discount, persistence, volatility, and price reaction can combine into a more complete derivatives-pressure read.
發行說明
🔧 UPDATE NOTES - V1.1This update focuses on publication readability, corridor clarity, and interface polish.
The core purpose of the script remains unchanged.
This release improves how the existing carry stress logic is presented, organized, and interpreted on the chart.
This script continues to function as an analytical and visualization tool.
It does not attempt to predict price direction or provide guaranteed outcomes.
------------------------
What Changed
------------------------
• Refined the centered carry corridor badge
The corridor label is now treated as a clearer premium badge that remains separate from the transparent stress corridor.
• Added Corridor Badge Anchor
Users can now control where the centered corridor badge appears inside the projected stress corridor.
• Added Right Tag Detail mode
Compact mode keeps publication screenshots cleaner, while Full mode provides additional premium, basis, stress, and persistence detail.
• Expanded panel location controls
The AG Pro panel now supports top, middle, and bottom alignment options including center placements.
• Tuned default event label spacing
Default label cooldown, label offset, and retained label count were adjusted to improve readability without making the chart feel empty.
------------------------
Visual Improvements
------------------------
• Preserved the carry stress corridor, reaction rails, baseline rail, right-side tags, and event labels
• Improved first-glance readability by making corridor text easier to position
• Reduced potential text crowding around the right-side tags through Compact / Full tag modes
• Adjusted event label spacing so labels sit more cleanly above or below candles
------------------------
Interface & Usability
------------------------
• Preserved the single merged blue AG Pro panel header row
• Kept Dark, Slate, and Light panel themes
• Added full panel location control including center positions
• Kept panel visibility, panel font-size, and label font-size controls available from settings
------------------------
Behavior Notes
------------------------
This update does not change the core analytical purpose of the script.
The goal is to improve clarity and usability while preserving the visual planning story of the original carry stress map.
Users should interpret outputs the same way as before, but with improved label positioning and cleaner interface controls.
------------------------
Limitations Reminder
------------------------
The script remains a rule-based analytical tool.
Reference-symbol selection, exchange differences, volatility conditions, and timeframe changes may affect how premium and stress states appear.
Outputs should always be interpreted within broader market context.
------------------------
Risk Reminder
------------------------
This script is for educational and analytical purposes only.
It does not provide financial advice or guaranteed trading outcomes.
Users remain responsible for their own decisions.
發行說明
🔧 UPDATE NOTES - v1.2This update focuses on reference accuracy, readability, and decision usability.
The core purpose of the script remains unchanged. It continues to map carry
stress context, classify long-side and short-side crowding, and summarize
premium/basis pressure inside the AG Pro panel.
This script remains an analytical and visualization tool. It does not attempt to
predict price direction or provide guaranteed outcomes.
------------------------
What Changed
------------------------
• Real perp-vs-spot basis in Auto mode
The automatic reference now pairs the chart with the opposite contract type: a
spot chart is compared against its perpetual, and a perpetual chart against its
spot. Previously the auto reference could resolve to the same symbol as the
chart, which made the premium read flat. The premium sign is normalized so a
positive value always means the perpetual is trading above spot.
• Reference safety and clear warning
If a matching perp/spot pair is not available, the script no longer breaks. It
returns a clean "Check Spot Ref" state and shows "No Pair Found" in the panel so
the reference can be corrected, instead of silently showing a flat reading.
• Carry Reaction Rate
A new stop-aware statistic reports, of past crowded carry states, how many
reacted against the crowd by the reaction target before extending with the crowd
to the continuation stop. It is evaluated on confirmed bars only, shows
"Building (n)" until enough samples exist, and is color-graded by tier.
• Decision-oriented panel
The panel now ends with an Action read (watch for fade, watch for bounce, stress
easing, crowded reaction, or check reference) alongside the Reaction Rate, so the
dashboard guides interpretation rather than only listing values.
• Readable badges and tags
All on-chart labels, the corridor badge, and the right-side tags now use a
luminance-aware text color, so text stays legible on every state color.
------------------------
Visual Improvements
------------------------
• Improved chart readability by placing dark or light text automatically on each colored fill
• Reduced visual clutter to enhance first-glance interpretation
• Refined visual hierarchy so the active state and reaction read stand out more clearly
• Adjusted the minimum corridor width so the three right-side tags no longer overlap when stress is low
------------------------
Interface & Usability
------------------------
• Optimized panel layout for clearer information flow, ending on an action read
• Improved label readability for better chart interaction
• Adjusted default visual settings for a more balanced appearance
• Enhanced overall user experience while keeping the carry stress logic familiar
------------------------
Behavior Notes
------------------------
The analytical model is the same, but the automatic reference pairing was
corrected so the premium reflects a genuine perpetual-versus-spot basis.
For the most meaningful reading, use the indicator on a perpetual chart (auto
reference resolves to spot) or on a spot chart (auto reference resolves to the
perpetual). Manual reference mode is available for custom pairs.
The Reaction Rate describes historical behavior only and is not a forecast.
------------------------
Limitations Reminder
------------------------
The script remains a rule-based analytical tool.
Market conditions such as volatility, liquidity, exchange differences, and
timeframe differences may affect how signals and basis readings appear.
Outputs should always be interpreted within broader market context.
------------------------
Risk Reminder
------------------------
This script is for educational and analytical purposes only.
It does not provide financial advice or guaranteed trading outcomes.
Users remain responsible for their own decisions.
開源腳本
秉持TradingView一貫精神,這個腳本的創作者將其設為開源,以便交易者檢視並驗證其功能。向作者致敬!您可以免費使用此腳本,但請注意,重新發佈代碼需遵守我們的社群規範。

Public-free scripts + invite-only AGPro workflows for market analysis, liquidity context, risk planning and execution review.
Rules-based. No hype. No guesswork.
Library & access: agprolabs.com/
Telegram: t.me/agprolabs
Rules-based. No hype. No guesswork.
Library & access: agprolabs.com/
Telegram: t.me/agprolabs
免責聲明
這些資訊和出版物並非旨在提供,也不構成TradingView提供或認可的任何形式的財務、投資、交易或其他類型的建議或推薦。請閱讀使用條款以了解更多資訊。
開源腳本
秉持TradingView一貫精神,這個腳本的創作者將其設為開源,以便交易者檢視並驗證其功能。向作者致敬!您可以免費使用此腳本,但請注意,重新發佈代碼需遵守我們的社群規範。
Public-free scripts + invite-only AGPro workflows for market analysis, liquidity context, risk planning and execution review.
Rules-based. No hype. No guesswork.
Library & access: agprolabs.com/
Telegram: t.me/agprolabs
Rules-based. No hype. No guesswork.
Library & access: agprolabs.com/
Telegram: t.me/agprolabs
免責聲明
這些資訊和出版物並非旨在提供,也不構成TradingView提供或認可的任何形式的財務、投資、交易或其他類型的建議或推薦。請閱讀使用條款以了解更多資訊。