Volume Pressure Atlas [MQLSoftware]
來自MQLSoftware的更多獨家指標
以每月$69.00的價格訂閱MQLSoftware Pro Analysis Suite,即可取得該作者的獨家指標。您可直接在TradingView付款並立即於圖表上使用。
探索MQLSoftware Pro Analysis SuiteOverview
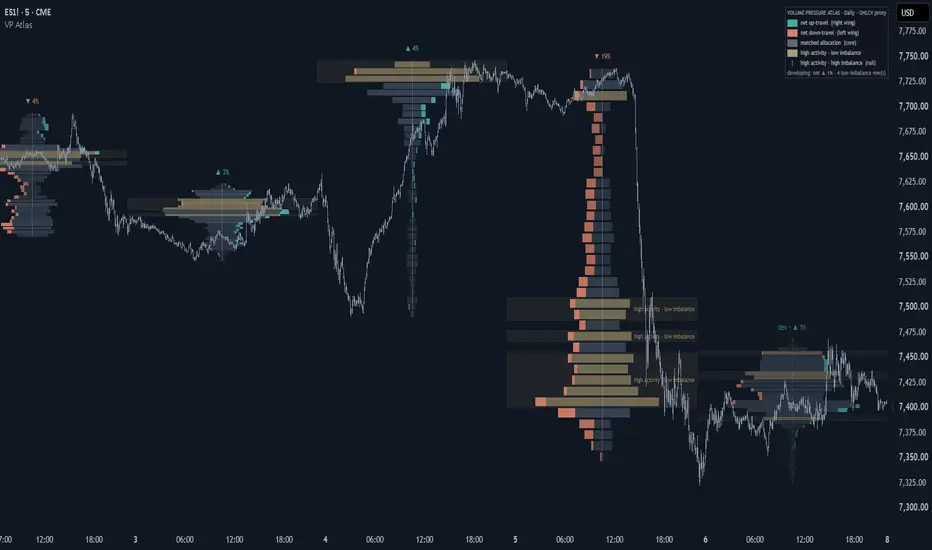
Volume Pressure Atlas draws a two-sided volume profile for each period using a stated OHLC path assumption. A central core shows matched upward and downward allocation; a colored wing shows the unmatched portion. It helps compare concentrated activity with directional balance within that model. It does not observe volume at price or order flow.
How the model works
A rising candle is modeled as open → low → high → close; a falling candle as open → high → low → close. Both orders tie for a doji. The minimum distance is 2 × (high−low) − abs(close−open). Volume is spread uniformly over this assumed distance. Minimum travel and constant volume per distance are two assumptions, not information recovered from the tape.
Body prices are crossed once in the candle's direction; wick prices once each way. Overlap with each row produces upward allocation U and downward allocation D. Their total across all rows equals usable reported volume. A flat candle's volume is split equally in its row; gaps between candles receive no invented volume.
The core represents 2 × min(U,D), and the wing abs(U−D). Row imbalance E = abs(U−D)/(U+D) measures inequality between the assigned components. It is not price displacement, trading efficiency, absorption, or subsequent return. A small wing can coexist with a large price move.
Reading the display
At the defaults, elevated activity means at least 1.25 times the average volume of active rows. Reference imbalance is the weighted mean Eref = sum(abs(U−D))/sum(U+D). Low-imbalance rows are at or below Eref/2 and intersect at least three volume-bearing bars. High-imbalance rows are at or above Eref×2. If the upper threshold exceeds 1, that class is empty. At a zero reference, eligible exactly balanced rows can qualify as low imbalance.
These are descriptive filters, not significance tests. The earlier effort/result terminology is replaced by Activity-Imbalance Map: no subsequent result is measured and no predictive divergence signal is established. Similar class frequencies across markets can arise from normalization and overlapping candles.
Use the map to compare where the model assigns concentrated volume and whether that allocation is balanced or one-sided, alongside visible candle structure. Widths are normalized separately within each atlas; equal widths do not mean equal volume across periods. Neither a wide core nor a highlighted row proves absorption or an approaching reversal.
Controls
Auto uses Day through 15-minute charts, Week through 1 hour, Month through 4 hours, Quarter on daily charts, and Year above daily. Anchors follow TradingView's exchange/session boundaries, rather than the chart's display timezone. Too-short manual periods move upward, up to Year; periods estimated to exceed 5,000 chart bars in a 24/7 session move downward. A hard 5,000-bar cap splits unusually long periods. First loaded periods and capped segments are marked partial.
Choose 24, 36 or 48 rows, no thinner than one tick. A 450-box working budget limits history: with developing enabled, Compact supports seven completed atlases, Balanced five, and Fine three. The default is five Balanced atlases. Colors, opacity, placement, bands, rails, tags and legend are adjustable. The script leaves candle colors to the user's chart settings.
Timing and limitations
Confirmed bars enter storage once. A completed atlas is built on the next period's first chart bar; the commit alert confirms at that bar's close. Final rows and classes are drawn across the earlier period as a retrospective summary. They were not available on those earlier bars.
The developing atlas includes the forming bar and changes as its prices, volume and range evolve. Retained completed geometry stays fixed during a run; only the latest completed atlas keeps zone captions. Reloading, loaded history, inputs, chart timeframe, sessions or feed revisions can change reconstructed history. There are no higher-timeframe requests or future-bar calculations. TradingView may display a general repainting caution when creating alerts; commit messages use stored closed-period data with a bar-close gate.
Use standard time-based candles below yearly resolution. Coarser OHLC bars conceal more intrabar movement, so different timeframes can produce different maps. Missing/nonpositive volume and invalid OHLC contribute no allocation; incomplete coverage is not reconstructed. A symbol without usable volume shows a notice. Some forex/CFD feeds supply tick counts rather than traded volume, and a nonzero field does not establish data quality.
What is distinct
This combines minimum-path directional row allocation, matched-core/residual-wing geometry, and period-relative activity/imbalance classification. Directional volume proxies and mirrored profiles are established ideas; the claim is this particular construction and interpretation.
Unlike Volume Nodes & Value Migration, it has no POC/value-area migration, node acceptance state machine or measured retest statistics. This separate study describes the distribution and balance of an assumed allocation. It supplies no entries, forecasts or performance claims.
Volume Pressure Atlas draws a two-sided volume profile for each period using a stated OHLC path assumption. A central core shows matched upward and downward allocation; a colored wing shows the unmatched portion. It helps compare concentrated activity with directional balance within that model. It does not observe volume at price or order flow.
How the model works
A rising candle is modeled as open → low → high → close; a falling candle as open → high → low → close. Both orders tie for a doji. The minimum distance is 2 × (high−low) − abs(close−open). Volume is spread uniformly over this assumed distance. Minimum travel and constant volume per distance are two assumptions, not information recovered from the tape.
Body prices are crossed once in the candle's direction; wick prices once each way. Overlap with each row produces upward allocation U and downward allocation D. Their total across all rows equals usable reported volume. A flat candle's volume is split equally in its row; gaps between candles receive no invented volume.
The core represents 2 × min(U,D), and the wing abs(U−D). Row imbalance E = abs(U−D)/(U+D) measures inequality between the assigned components. It is not price displacement, trading efficiency, absorption, or subsequent return. A small wing can coexist with a large price move.
Reading the display
- Teal is net upward allocation on the right, coral net downward allocation on the left, and slate the matched core.
- Sand highlights elevated activity with relatively low imbalance.
- Bright wings and edge rails mark elevated activity with relatively high imbalance.
- The faded, dashed atlas is developing.
- Period tags show signed allocation imbalance.
At the defaults, elevated activity means at least 1.25 times the average volume of active rows. Reference imbalance is the weighted mean Eref = sum(abs(U−D))/sum(U+D). Low-imbalance rows are at or below Eref/2 and intersect at least three volume-bearing bars. High-imbalance rows are at or above Eref×2. If the upper threshold exceeds 1, that class is empty. At a zero reference, eligible exactly balanced rows can qualify as low imbalance.
These are descriptive filters, not significance tests. The earlier effort/result terminology is replaced by Activity-Imbalance Map: no subsequent result is measured and no predictive divergence signal is established. Similar class frequencies across markets can arise from normalization and overlapping candles.
Use the map to compare where the model assigns concentrated volume and whether that allocation is balanced or one-sided, alongside visible candle structure. Widths are normalized separately within each atlas; equal widths do not mean equal volume across periods. Neither a wide core nor a highlighted row proves absorption or an approaching reversal.
Controls
Auto uses Day through 15-minute charts, Week through 1 hour, Month through 4 hours, Quarter on daily charts, and Year above daily. Anchors follow TradingView's exchange/session boundaries, rather than the chart's display timezone. Too-short manual periods move upward, up to Year; periods estimated to exceed 5,000 chart bars in a 24/7 session move downward. A hard 5,000-bar cap splits unusually long periods. First loaded periods and capped segments are marked partial.
Choose 24, 36 or 48 rows, no thinner than one tick. A 450-box working budget limits history: with developing enabled, Compact supports seven completed atlases, Balanced five, and Fine three. The default is five Balanced atlases. Colors, opacity, placement, bands, rails, tags and legend are adjustable. The script leaves candle colors to the user's chart settings.
Timing and limitations
Confirmed bars enter storage once. A completed atlas is built on the next period's first chart bar; the commit alert confirms at that bar's close. Final rows and classes are drawn across the earlier period as a retrospective summary. They were not available on those earlier bars.
The developing atlas includes the forming bar and changes as its prices, volume and range evolve. Retained completed geometry stays fixed during a run; only the latest completed atlas keeps zone captions. Reloading, loaded history, inputs, chart timeframe, sessions or feed revisions can change reconstructed history. There are no higher-timeframe requests or future-bar calculations. TradingView may display a general repainting caution when creating alerts; commit messages use stored closed-period data with a bar-close gate.
Use standard time-based candles below yearly resolution. Coarser OHLC bars conceal more intrabar movement, so different timeframes can produce different maps. Missing/nonpositive volume and invalid OHLC contribute no allocation; incomplete coverage is not reconstructed. A symbol without usable volume shows a notice. Some forex/CFD feeds supply tick counts rather than traded volume, and a nonzero field does not establish data quality.
What is distinct
This combines minimum-path directional row allocation, matched-core/residual-wing geometry, and period-relative activity/imbalance classification. Directional volume proxies and mirrored profiles are established ideas; the claim is this particular construction and interpretation.
Unlike Volume Nodes & Value Migration, it has no POC/value-area migration, node acceptance state machine or measured retest statistics. This separate study describes the distribution and balance of an assumed allocation. It supplies no entries, forecasts or performance claims.

🟣 Free tools, guides & product resources:
mqlsoftware.com/account/
🟣 New tools, releases & updates:
t.me/mqlsoftware_official
MQLSoftware — trading analysis tools & indicators.
mqlsoftware.com/account/
🟣 New tools, releases & updates:
t.me/mqlsoftware_official
MQLSoftware — trading analysis tools & indicators.
免責聲明
這些資訊和出版物並非旨在提供,也不構成TradingView提供或認可的任何形式的財務、投資、交易或其他類型的建議或推薦。請閱讀使用條款以了解更多資訊。
🟣 Free tools, guides & product resources:
mqlsoftware.com/account/
🟣 New tools, releases & updates:
t.me/mqlsoftware_official
MQLSoftware — trading analysis tools & indicators.
mqlsoftware.com/account/
🟣 New tools, releases & updates:
t.me/mqlsoftware_official
MQLSoftware — trading analysis tools & indicators.
免責聲明
這些資訊和出版物並非旨在提供,也不構成TradingView提供或認可的任何形式的財務、投資、交易或其他類型的建議或推薦。請閱讀使用條款以了解更多資訊。