OPEN-SOURCE SCRIPT
Clean Key Levels Map
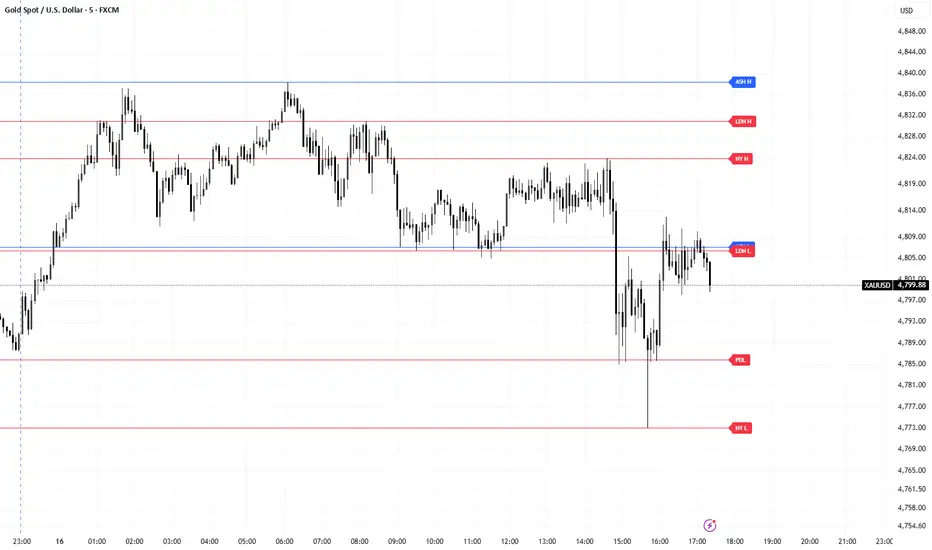
Clean Key Levels Map
Clean Key Levels Map is a simple level-marking indicator designed for traders who want an uncluttered chart with only the most important reference prices.
This tool plots key levels from higher timeframes and major trading sessions, with short labels printed on the right side for quick identification. All lines begin from the start of the current trading day, which keeps the chart clean and structured for intraday decision-making.
Included levels
Previous Day High and Low
Previous NY Session High and Low
Asia Session High and Low
London Session High and Low
Weekly High and Low
Monthly High and Low
Features
Clean horizontal line layout
Short level names on the right side
Custom on/off toggle for each level group
Custom color selection for each level group
Adjustable line width
Adjustable label offset
Optional auto-delete of old levels on a new day
Built for traders who prefer a simple chart without unnecessary signals
Best use
This indicator is best used as a visual map for:
liquidity levels
session highs and lows
reaction zones
intraday context
breakout and sweep-based trading
It does not generate buy or sell signals. Its purpose is to help traders read price around important levels with clarity.
Notes
Previous NY High and Low are based on the defined NY session input
Asia and London levels are based on their completed session ranges
Weekly and Monthly levels are taken from the previous completed week and month
All lines are designed to start from the beginning of the current trading day for a cleaner intraday view
This indicator is ideal for traders who use price action, sweeps, session liquidity, ORB, or level-to-level trading and want a clean framework on the chart.
Clean Key Levels Map is a simple level-marking indicator designed for traders who want an uncluttered chart with only the most important reference prices.
This tool plots key levels from higher timeframes and major trading sessions, with short labels printed on the right side for quick identification. All lines begin from the start of the current trading day, which keeps the chart clean and structured for intraday decision-making.
Included levels
Previous Day High and Low
Previous NY Session High and Low
Asia Session High and Low
London Session High and Low
Weekly High and Low
Monthly High and Low
Features
Clean horizontal line layout
Short level names on the right side
Custom on/off toggle for each level group
Custom color selection for each level group
Adjustable line width
Adjustable label offset
Optional auto-delete of old levels on a new day
Built for traders who prefer a simple chart without unnecessary signals
Best use
This indicator is best used as a visual map for:
liquidity levels
session highs and lows
reaction zones
intraday context
breakout and sweep-based trading
It does not generate buy or sell signals. Its purpose is to help traders read price around important levels with clarity.
Notes
Previous NY High and Low are based on the defined NY session input
Asia and London levels are based on their completed session ranges
Weekly and Monthly levels are taken from the previous completed week and month
All lines are designed to start from the beginning of the current trading day for a cleaner intraday view
This indicator is ideal for traders who use price action, sweeps, session liquidity, ORB, or level-to-level trading and want a clean framework on the chart.
開源腳本
秉持TradingView一貫精神,這個腳本的創作者將其設為開源,以便交易者檢視並驗證其功能。向作者致敬!您可以免費使用此腳本,但請注意,重新發佈代碼需遵守我們的社群規範。

免責聲明
這些資訊和出版物並非旨在提供,也不構成TradingView提供或認可的任何形式的財務、投資、交易或其他類型的建議或推薦。請閱讀使用條款以了解更多資訊。
開源腳本
秉持TradingView一貫精神,這個腳本的創作者將其設為開源,以便交易者檢視並驗證其功能。向作者致敬!您可以免費使用此腳本,但請注意,重新發佈代碼需遵守我們的社群規範。
免責聲明
這些資訊和出版物並非旨在提供,也不構成TradingView提供或認可的任何形式的財務、投資、交易或其他類型的建議或推薦。請閱讀使用條款以了解更多資訊。