已更新
DCA Bot Reality Check: Deal Profit vs Real Result
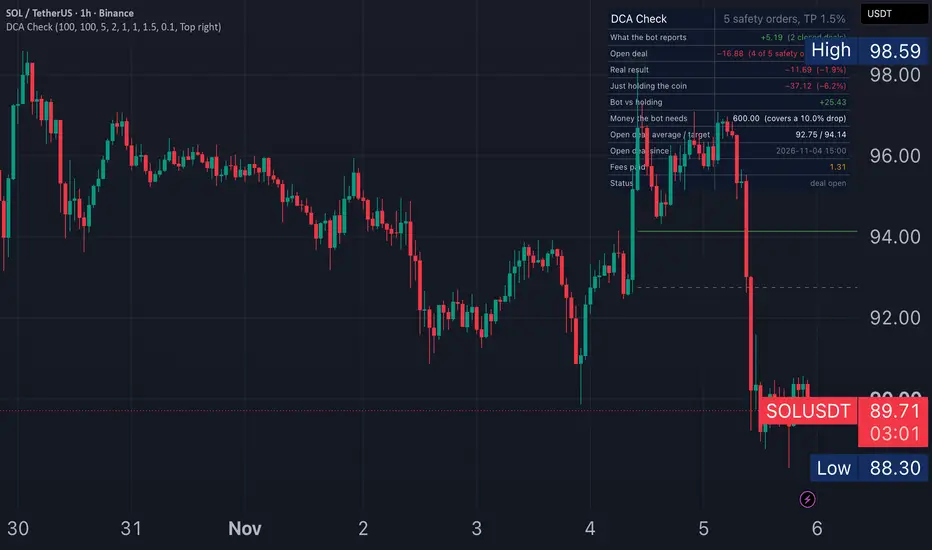
DCA Check replays a DCA bot (base order, safety orders, take profit) on any chart and puts the profit the bot reports next to the real result of the account. A DCA bot only reports a deal when it closes in profit. The deal that is still open, with every safety order it bought on the way down, isn't in that number until it closes. In a falling market that open deal is usually where the loss is.
HOW TO USE
- Add the script to the chart of the coin and timeframe you want to test.
- TradingView asks you to click the start candle. The first deal opens at its close.
- Open the settings to set the base order, safety order, max safety orders, price deviation, step scale, volume scale, take profit and fee, the same fields most DCA bots use.
- Green labels mark each closed deal and its profit. For the open deal, the dashed line is the average buy price, the green line the take profit target and the orange line the last safety order.
WHAT THE TABLE SHOWS
- What the bot reports: profit of closed deals after fees, and how many deals closed
- Open deal: the gain or loss on the deal that is still open, and how many safety orders it used
- Real result: cash plus the value of the coins held, minus the money the bot needs
- Just holding the coin: the same money bought at the start price and held
- Bot vs holding: the difference between the two
- Money the bot needs: base order plus every safety order, and the price drop that covers
- Open deal average, target, start time, fees paid, and a status line that says when the price is below the last safety order and the bot is stuck waiting
HOW IT COUNTS
- Safety order k fills at the deal's first buy price minus the price deviation, with each next step multiplied by the step scale. Its size is the safety order times the volume scale to the power k−1.
- The take profit is measured from the deal's average buy price, like most DCA bots.
- A candle doesn't show whether its high or its low came first. So on each candle the take profit is checked first, using the average from before that candle. If it isn't reached, safety orders fill on the low.
- After a take profit, the next deal opens at that candle's close.
- The fee is charged on every buy and every sell.
- Real result and just holding use the same money: the base order plus all safety orders.
EXAMPLE ON THIS CHART
BINANCE SOLUSDT 1h, base order 100, safety order 100, 5 safety orders, 2% deviation, take profit 1.5%, 0.1% fee, started on Nov 1, 2026 at 95.53. By Nov 5 the bot had closed 2 deals for +5.19 of reported profit. The open deal had used 4 of 5 safety orders, average 92.75, target 94.14. Real result about −11 (−1.9%) of the 600 the bot needs. Just holding SOL: about −37 (−6.1%). The bot did better than holding, but the account is down while the reported profit only went up.
LIMITATIONS
- Spot, long-only DCA. No short bots, no leverage, no trailing take profit, no stop loss, no deal start conditions.
- It uses the candles on your chart. Real fills can differ by slippage, minimum order sizes and the exchange's rounding. Lower timeframes give a more precise replay.
- Bot platforms differ in how they report profit. Compare the real result, not the dashboard number.
This is an educational tool. It is not financial advice and does not generate signals or recommend any bot.
HOW TO USE
- Add the script to the chart of the coin and timeframe you want to test.
- TradingView asks you to click the start candle. The first deal opens at its close.
- Open the settings to set the base order, safety order, max safety orders, price deviation, step scale, volume scale, take profit and fee, the same fields most DCA bots use.
- Green labels mark each closed deal and its profit. For the open deal, the dashed line is the average buy price, the green line the take profit target and the orange line the last safety order.
WHAT THE TABLE SHOWS
- What the bot reports: profit of closed deals after fees, and how many deals closed
- Open deal: the gain or loss on the deal that is still open, and how many safety orders it used
- Real result: cash plus the value of the coins held, minus the money the bot needs
- Just holding the coin: the same money bought at the start price and held
- Bot vs holding: the difference between the two
- Money the bot needs: base order plus every safety order, and the price drop that covers
- Open deal average, target, start time, fees paid, and a status line that says when the price is below the last safety order and the bot is stuck waiting
HOW IT COUNTS
- Safety order k fills at the deal's first buy price minus the price deviation, with each next step multiplied by the step scale. Its size is the safety order times the volume scale to the power k−1.
- The take profit is measured from the deal's average buy price, like most DCA bots.
- A candle doesn't show whether its high or its low came first. So on each candle the take profit is checked first, using the average from before that candle. If it isn't reached, safety orders fill on the low.
- After a take profit, the next deal opens at that candle's close.
- The fee is charged on every buy and every sell.
- Real result and just holding use the same money: the base order plus all safety orders.
EXAMPLE ON THIS CHART
BINANCE SOLUSDT 1h, base order 100, safety order 100, 5 safety orders, 2% deviation, take profit 1.5%, 0.1% fee, started on Nov 1, 2026 at 95.53. By Nov 5 the bot had closed 2 deals for +5.19 of reported profit. The open deal had used 4 of 5 safety orders, average 92.75, target 94.14. Real result about −11 (−1.9%) of the 600 the bot needs. Just holding SOL: about −37 (−6.1%). The bot did better than holding, but the account is down while the reported profit only went up.
LIMITATIONS
- Spot, long-only DCA. No short bots, no leverage, no trailing take profit, no stop loss, no deal start conditions.
- It uses the candles on your chart. Real fills can differ by slippage, minimum order sizes and the exchange's rounding. Lower timeframes give a more precise replay.
- Bot platforms differ in how they report profit. Compare the real result, not the dashboard number.
This is an educational tool. It is not financial advice and does not generate signals or recommend any bot.
發行說明
v1.1: losing deals now show in red with the right sign (this can happen when the take profit is smaller than the fees), and the table gives a clear message when safety-order settings reach below zero. No change to the calculations.
免責聲明
這些資訊和出版物並非旨在提供,也不構成TradingView提供或認可的任何形式的財務、投資、交易或其他類型的建議或推薦。請閱讀使用條款以了解更多資訊。
免責聲明
這些資訊和出版物並非旨在提供,也不構成TradingView提供或認可的任何形式的財務、投資、交易或其他類型的建議或推薦。請閱讀使用條款以了解更多資訊。