Reballo Regime Detector - ER + RelVol + Autocorrelation
What it measures
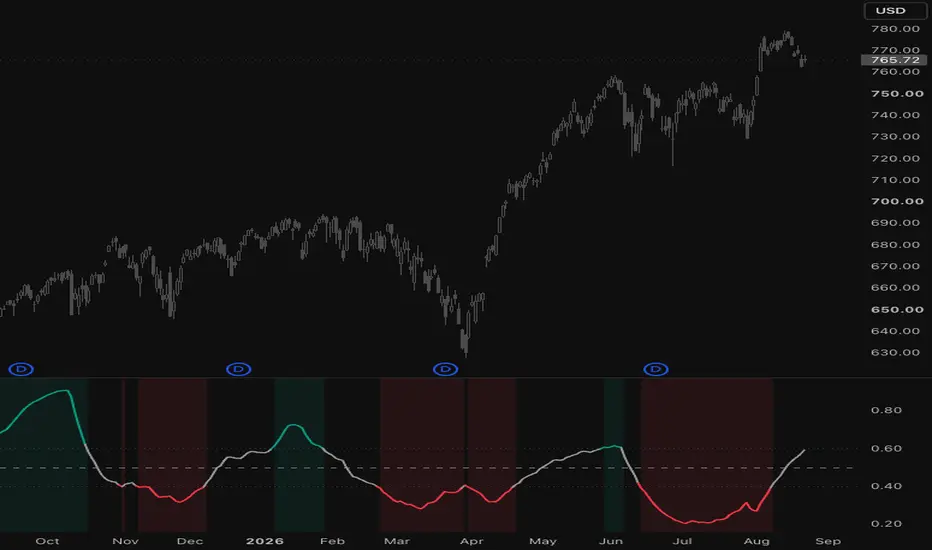
Most indicators try to tell you which way price is going. This one asks a different question: is the market in a mood where trend-following works, or one where fading works?
You get one number, the Regime Score, from 0 (ranging / choppy) to 1 (trending). Under the hood it blends three different ways of looking at price, each measured at three speeds (16 / 32 / 64 bars by default).
The three components
1. Efficiency Ratio (Kaufman)
How straight is the path? Net distance ÷ total distance travelled. Move 10 points in 10 points of wiggle: score 1.0. Wander 50 points to end up 10 higher: score 0.2. High = directional, low = chop.
2. Relative Volatility
Short-window vol ÷ long-window vol (4× the short window). Quiet, compressing vol usually goes with clean trends. Expanding vol usually means transitions and churn. Capped at 2 and flipped so that "quiet" scores high.
3. Lag-1 Autocorrelation
Does today's move tend to follow yesterday's? Positive = follow-through (momentum-friendly). Negative = snap-back (mean-reversion-friendly).
Components 2 and 3 get averaged into one "RelVol+AC" number. Then both that and the ER get percentile-ranked over the last year, so a 0.8 on BTC means the same thing as a 0.8 on a sleepy utility stock, and 4H reads the same as daily.
Putting it together
Default mix is 40% Efficiency Ratio / 60% RelVol+AC, smoothed with a 16-bar EMA so it doesn't flip on every bar. Above 0.60 = trending (green). Below 0.40 = ranging (red). The middle is left grey on purpose: that's the "don't know, don't force it" zone.
What's hiding in the Data Window
Ways to use it
Two alerts built in: regime → Trending and regime → Ranging.
Honest limitations
Settings
Open source. Fork it, break it, tell me what you find.
Most indicators try to tell you which way price is going. This one asks a different question: is the market in a mood where trend-following works, or one where fading works?
You get one number, the Regime Score, from 0 (ranging / choppy) to 1 (trending). Under the hood it blends three different ways of looking at price, each measured at three speeds (16 / 32 / 64 bars by default).
The three components
1. Efficiency Ratio (Kaufman)
How straight is the path? Net distance ÷ total distance travelled. Move 10 points in 10 points of wiggle: score 1.0. Wander 50 points to end up 10 higher: score 0.2. High = directional, low = chop.
2. Relative Volatility
Short-window vol ÷ long-window vol (4× the short window). Quiet, compressing vol usually goes with clean trends. Expanding vol usually means transitions and churn. Capped at 2 and flipped so that "quiet" scores high.
3. Lag-1 Autocorrelation
Does today's move tend to follow yesterday's? Positive = follow-through (momentum-friendly). Negative = snap-back (mean-reversion-friendly).
Components 2 and 3 get averaged into one "RelVol+AC" number. Then both that and the ER get percentile-ranked over the last year, so a 0.8 on BTC means the same thing as a 0.8 on a sleepy utility stock, and 4H reads the same as daily.
Putting it together
Default mix is 40% Efficiency Ratio / 60% RelVol+AC, smoothed with a 16-bar EMA so it doesn't flip on every bar. Above 0.60 = trending (green). Below 0.40 = ranging (red). The middle is left grey on purpose: that's the "don't know, don't force it" zone.
What's hiding in the Data Window
- Each component's rank on its own, so you can see what is actually moving the score.
- Two derived weights, Divergence Multiplier and Convergence Multiplier (range 1 ± strength). If you run trend and mean-reversion signals side by side, these are meant to tilt between them: scale trend signals by Divergence, counter-trend signals by Convergence. At strength 0.5, a fully trending regime gives trend signals 1.5× weight and counter-trend signals 0.5×.
Ways to use it
- As a filter: only take breakouts / momentum entries when it's green, only fade when it's red.
- As a sizing knob: use the multipliers to lean in or out instead of switching strategies on and off.
- As a sanity check: when it flips, peek at the Data Window to see whether vol, path efficiency or autocorrelation moved first.
Two alerts built in: regime → Trending and regime → Ranging.
Honest limitations
- Needs about a year of bars (252 by default) before the ranking means anything.
- It tells you what the regime is, not when it's going to change.
- It doesn't care about direction. A clean crash scores as "trending" too.
Settings
- Fast / Medium / Slow — 16 / 32 / 64 — speeds for all three measures
- Weight: ER / RelVol+AC — 0.4 / 0.6 — how much each side counts
- Percentile Rank Lookback — 252 — the "last year" window
- Score Smoothing — 16 — EMA on the final score
- Trending Above / Ranging Below — 0.60 / 0.40 — where the shading kicks in
- Multiplier Strength — 0.5 — only touches the hidden multipliers
Open source. Fork it, break it, tell me what you find.

免責聲明
這些資訊和出版物並非旨在提供,也不構成TradingView提供或認可的任何形式的財務、投資、交易或其他類型的建議或推薦。請閱讀使用條款以了解更多資訊。
免責聲明
這些資訊和出版物並非旨在提供,也不構成TradingView提供或認可的任何形式的財務、投資、交易或其他類型的建議或推薦。請閱讀使用條款以了解更多資訊。