Donato Trend Stength Index
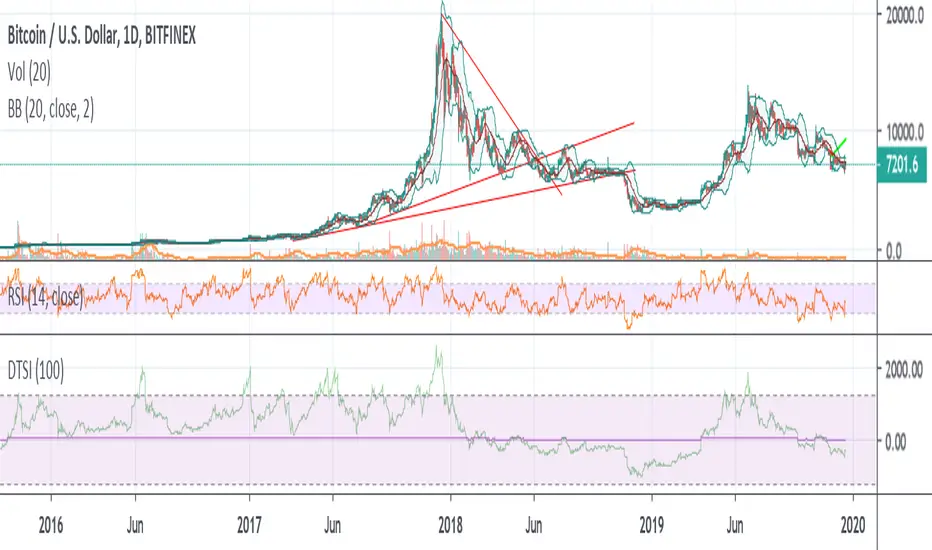
This indicator is a basic way to look at longer periods of time and look for exhaustion based on closes above or below RSI50. The first output is RSI14 the second is a rolling 100 day aggregate of closes where 50 acts as 0. As of now it appears totals of 1200+ /-1200- could be considered overbought / oversold, respectively. Totals near or above / below 2000 / -2000 (respectively) could be great indicators of extreme trend exhaustion and impending reversal.

Charts and ratios nobody else publishes: livebtcnews.com and make sure to check out Sleepless Markets (YouTube) for live price tracking and volatility alerts.
免責聲明
這些資訊和出版物並非旨在提供,也不構成TradingView提供或認可的任何形式的財務、投資、交易或其他類型的建議或推薦。請閱讀使用條款以了解更多資訊。
Charts and ratios nobody else publishes: livebtcnews.com and make sure to check out Sleepless Markets (YouTube) for live price tracking and volatility alerts.
免責聲明
這些資訊和出版物並非旨在提供,也不構成TradingView提供或認可的任何形式的財務、投資、交易或其他類型的建議或推薦。請閱讀使用條款以了解更多資訊。