OPEN-SOURCE SCRIPT
Multi-Symbol RSI Portfolio Simulator [Honestcowboy]
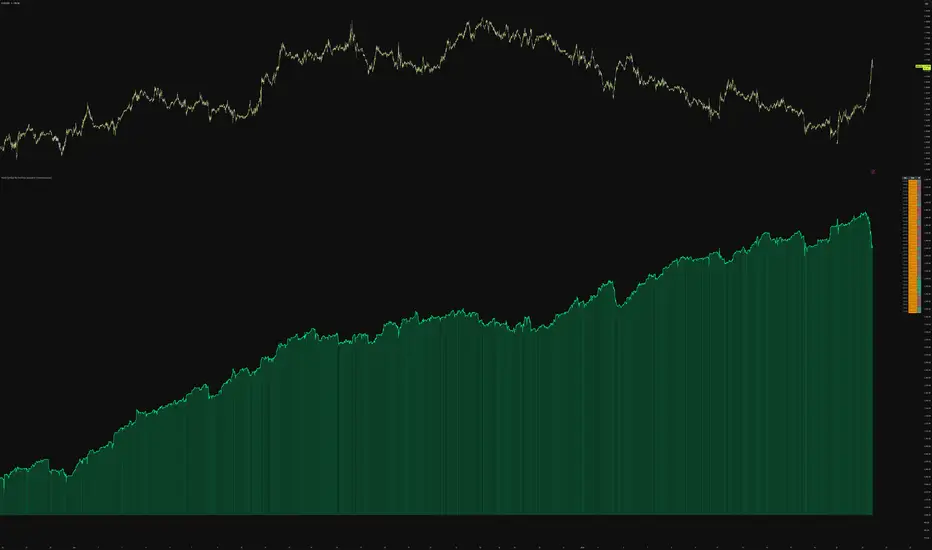
The Multi-Symbol RSI Portfolio Simulator was build to test a theory, does the RSI indicator work in FOREX assets. Does it have predictive power. In this example the security function is used to fetch data for 40 different Forex pairs and it executes a very simple trading strategy. Sell when RSI hits 80, flatten if back below. Buy when RSI hits 20, flatten if back above. All executed on bar closes so no intra bar stuff.
🟦 🟦 🟦 Very Important Disclaimer
This is a very crude indicator which does not calculate trading costs and assumes perfect execution of trades with zero slippage. Forex markets carry high risk and most CFD brokers ask high spreads and trading costs so this approach will most likely only work on the H4 or above Daily charts. We are observing market behaviour here, it's a study of price action not an executable ready strategy. Do your own cost analysis, simulation if you want to take this idea further.
🟦 What is the point?
I build this indicator to prove that RSI indeed causes price action reactions especially on the intraday level in forex. Just like any study or paper not accounting for trading costs, this is just hypothetical and a starting point.
🟦 CALCULATION
On each bar close it will check RSI value for each pair in the list. If one of the pairs meets the condition for a long or short it will open that trade on next bar open and hold it till close. Add the profits/losses to the equity line. And if condition still true on next bar do it again, this is a very crude simple form of testing. Tradingview strategy tester is superior but does not allow for multi-pair trading.
The indicator also has 2 modes: Mean reversion and Trend mode. On default it uses Mean Reversion which is explained above. Trend mode does the exact opposite, so long above 80 short below 20.
I've also included a table with a heatmap showing all the trading pairs the indicator uses, it's current RSI value and color based on how close indicator is to shorting or longing it from green to red with gray being middle so no direction.
🟦 USE CASES
You can tweak the setting for different RSI values. Different RSI lengths and also freely change any trading pair inside the list to make your own test. I'm including some screenshots of tests here below:


🟦 🟦 🟦 Very Important Disclaimer
This is a very crude indicator which does not calculate trading costs and assumes perfect execution of trades with zero slippage. Forex markets carry high risk and most CFD brokers ask high spreads and trading costs so this approach will most likely only work on the H4 or above Daily charts. We are observing market behaviour here, it's a study of price action not an executable ready strategy. Do your own cost analysis, simulation if you want to take this idea further.
🟦 What is the point?
I build this indicator to prove that RSI indeed causes price action reactions especially on the intraday level in forex. Just like any study or paper not accounting for trading costs, this is just hypothetical and a starting point.
🟦 CALCULATION
On each bar close it will check RSI value for each pair in the list. If one of the pairs meets the condition for a long or short it will open that trade on next bar open and hold it till close. Add the profits/losses to the equity line. And if condition still true on next bar do it again, this is a very crude simple form of testing. Tradingview strategy tester is superior but does not allow for multi-pair trading.
- Short Condition: RSI above 80
- Short Exit: RSI below 70
- Long Condition: RSI below 20
- Long Exit: RSI above 30
The indicator also has 2 modes: Mean reversion and Trend mode. On default it uses Mean Reversion which is explained above. Trend mode does the exact opposite, so long above 80 short below 20.
I've also included a table with a heatmap showing all the trading pairs the indicator uses, it's current RSI value and color based on how close indicator is to shorting or longing it from green to red with gray being middle so no direction.
🟦 USE CASES
You can tweak the setting for different RSI values. Different RSI lengths and also freely change any trading pair inside the list to make your own test. I'm including some screenshots of tests here below:
開源腳本
秉持TradingView一貫精神,這個腳本的創作者將其設為開源,以便交易者檢視並驗證其功能。向作者致敬!您可以免費使用此腳本,但請注意,重新發佈代碼需遵守我們的社群規範。

Get access here: whop.com/chartmuse
Starter ($19/mo) — Pick one indicator
Pro ($39/mo) — Full suite including News Reaction Indicator
Elite ($99/mo) — Everything + PropSiren + direct access
Questions? DM me on X: @ChartMuse
Starter ($19/mo) — Pick one indicator
Pro ($39/mo) — Full suite including News Reaction Indicator
Elite ($99/mo) — Everything + PropSiren + direct access
Questions? DM me on X: @ChartMuse
免責聲明
這些資訊和出版物並非旨在提供,也不構成TradingView提供或認可的任何形式的財務、投資、交易或其他類型的建議或推薦。請閱讀使用條款以了解更多資訊。
開源腳本
秉持TradingView一貫精神,這個腳本的創作者將其設為開源,以便交易者檢視並驗證其功能。向作者致敬!您可以免費使用此腳本,但請注意,重新發佈代碼需遵守我們的社群規範。
Get access here: whop.com/chartmuse
Starter ($19/mo) — Pick one indicator
Pro ($39/mo) — Full suite including News Reaction Indicator
Elite ($99/mo) — Everything + PropSiren + direct access
Questions? DM me on X: @ChartMuse
Starter ($19/mo) — Pick one indicator
Pro ($39/mo) — Full suite including News Reaction Indicator
Elite ($99/mo) — Everything + PropSiren + direct access
Questions? DM me on X: @ChartMuse
免責聲明
這些資訊和出版物並非旨在提供,也不構成TradingView提供或認可的任何形式的財務、投資、交易或其他類型的建議或推薦。請閱讀使用條款以了解更多資訊。