OPEN-SOURCE SCRIPT
已更新 AG Pro Pivot Cluster Survival Map [AGPro Series]
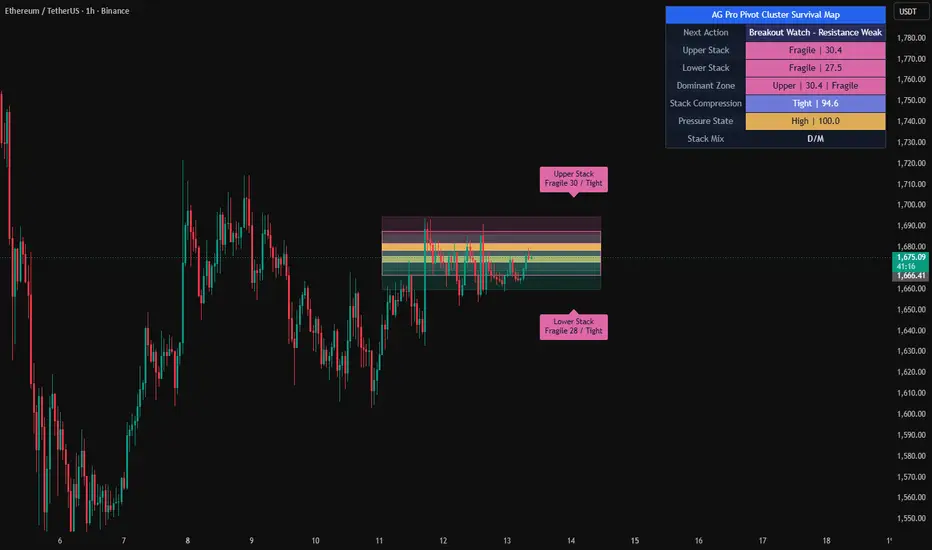
AG Pro Pivot Cluster Survival Map [AGPro Series]
Overview / What it does
AG Pro Pivot Cluster Survival Map is an overlay tool that evaluates the durability of nearby pivot clusters rather than focusing on a single pivot reaction. The script groups Daily, Weekly, and Monthly Classic Pivot levels when they compress into the same price neighborhood, then measures how well that cluster has held up under repeated interaction.
The goal is not to label every pivot touch as strong or weak. The goal is to show whether a pivot-derived zone has continued to absorb pressure, remain structurally relevant, or lose stability over time. This makes the script suitable for users who want to monitor confluence-based pivot structure instead of isolated one-bar reactions.
The visual model is intentionally compact. The script highlights the nearest upper cluster and the nearest lower cluster, assigns a survival score to each side, and displays a pressure readout for the dominant active zone. The result is a map of pivot-cluster durability, not a generic support/resistance overlay and not a simple reaction detector.
Unique Edge
The distinguishing feature of this script is its focus on pivot-cluster survival.
Many pivot tools concentrate on one level at a time. Many reaction tools classify the immediate response after a touch, reclaim, or rejection. This script approaches the problem differently. It asks whether multiple pivot levels from different higher timeframes are compressing into the same zone, and whether that zone is still surviving repeated market interaction.
That difference matters.
This script does not score a single bounce. It does not try to predict a reversal from one isolated pivot event. It evaluates whether a pivot cluster remains durable after tests, inside-zone pressure, breaches, and time spent without structural failure.
Within the AG Pro catalog, this script is materially different from AG Pro Pivot Points Reaction Map. Pivot Points Reaction Map is centered on reaction quality at pivot levels. Pivot Cluster Survival Map is centered on cluster durability, confluence density, and survival under pressure. In other words, one evaluates the response; the other evaluates the staying power of the pivot cluster itself.
It is also different from broader level-survival or support/resistance tools because the source engine here is explicitly pivot-derived. The script is built around Daily, Weekly, and Monthly Classic Pivot families, then transformed into a confluence-survival framework.
Methodology
The current version uses Classic Pivot calculations from higher timeframes.
1. Daily, Weekly, and Monthly pivot levels are collected.
2. Nearby pivot levels are grouped into clusters when they fall within the active cluster width.
3. The script selects the nearest upper cluster and the nearest lower cluster relative to current price.
4. Each selected cluster is evaluated with a survival model.
The survival model is based on factors such as:
- cluster density
- higher-timeframe participation
- repeated tests
- rejection behavior
- inside-zone pressure
- breach frequency
- time since structural failure
A higher survival score suggests that the cluster has remained more durable under recent interaction. A higher pressure reading suggests that the cluster is experiencing more structural stress.
The chart display is intentionally selective. Instead of plotting every pivot line independently, the script concentrates on the nearest relevant clusters and presents them as zones with a backbone line and state label. This is designed to keep the structure readable.
States / Signals
The script uses state-based interpretation rather than directional promises.
Typical state classifications include:
- Stable
- Strengthening
- Balanced
- Under Stress
- Fragile
- Failed
These states are derived from the relationship between survival and pressure. They are meant to describe the condition of the cluster, not to issue a guaranteed trading outcome.
The panel summarizes:
- nearest upper cluster
- nearest lower cluster
- dominant survival side
- cluster pressure
- pivot mix currently included in the model
The script can also generate alert conditions for:
- cluster strengthening
- cluster failure
- cluster reclaim behavior
These alerts are deterministic conditions derived from the script logic. They are informational and should be interpreted within a broader market workflow.
Key Inputs
Pivot Formula
This version is intentionally limited to Classic Pivots in order to keep the clustering and scoring model consistent.
Include Daily / Weekly / Monthly
These settings control which higher-timeframe pivot families are included in the cluster engine.
Cluster ATR Width
Controls how aggressively nearby pivot levels are merged into the same cluster using ATR-based spacing.
Cluster Percent Width
Adds a percentage-based width floor so clusters remain practical across different price scales.
Minimum Levels Per Cluster
Controls how many pivot levels are required before a true cluster is recognized.
Survival Lookback
Defines the observation window used for the durability calculations.
Visual Controls
The script includes settings for cluster visibility, labels, backbone lines, panel location, and font sizes.
Limitations & Transparency
This script is a structural reading tool. It is not a prediction engine.
A high survival score does not guarantee that price will reverse, hold, or trend from that area. A low survival score does not guarantee immediate failure. The values should be read as condition metrics for pivot-derived zones.
Because the script groups pivot levels into clusters, output can vary depending on volatility, symbol characteristics, and timeframe context. On some symbols, one side may show a stronger cluster than the other. On some charts, one side may temporarily rely on a weaker fallback anchor when cluster density is limited.
This script does not attempt to replace market structure analysis, higher-timeframe context, liquidity analysis, or risk management. It is intended to organize pivot confluence into a readable survival framework.
What this script is not:
- not a buy/sell signal engine
- not a guarantee of support or resistance
- not a standalone trade system
- not a future-price prediction model
Risk Disclosure
This script is for chart analysis and decision support only. It does not provide financial, investment, or trading advice. Markets can move unpredictably, and no indicator can eliminate risk.
Users should evaluate signals, states, and cluster conditions together with their own process, timeframe alignment, and risk controls before making any decision.
Overview / What it does
AG Pro Pivot Cluster Survival Map is an overlay tool that evaluates the durability of nearby pivot clusters rather than focusing on a single pivot reaction. The script groups Daily, Weekly, and Monthly Classic Pivot levels when they compress into the same price neighborhood, then measures how well that cluster has held up under repeated interaction.
The goal is not to label every pivot touch as strong or weak. The goal is to show whether a pivot-derived zone has continued to absorb pressure, remain structurally relevant, or lose stability over time. This makes the script suitable for users who want to monitor confluence-based pivot structure instead of isolated one-bar reactions.
The visual model is intentionally compact. The script highlights the nearest upper cluster and the nearest lower cluster, assigns a survival score to each side, and displays a pressure readout for the dominant active zone. The result is a map of pivot-cluster durability, not a generic support/resistance overlay and not a simple reaction detector.
Unique Edge
The distinguishing feature of this script is its focus on pivot-cluster survival.
Many pivot tools concentrate on one level at a time. Many reaction tools classify the immediate response after a touch, reclaim, or rejection. This script approaches the problem differently. It asks whether multiple pivot levels from different higher timeframes are compressing into the same zone, and whether that zone is still surviving repeated market interaction.
That difference matters.
This script does not score a single bounce. It does not try to predict a reversal from one isolated pivot event. It evaluates whether a pivot cluster remains durable after tests, inside-zone pressure, breaches, and time spent without structural failure.
Within the AG Pro catalog, this script is materially different from AG Pro Pivot Points Reaction Map. Pivot Points Reaction Map is centered on reaction quality at pivot levels. Pivot Cluster Survival Map is centered on cluster durability, confluence density, and survival under pressure. In other words, one evaluates the response; the other evaluates the staying power of the pivot cluster itself.
It is also different from broader level-survival or support/resistance tools because the source engine here is explicitly pivot-derived. The script is built around Daily, Weekly, and Monthly Classic Pivot families, then transformed into a confluence-survival framework.
Methodology
The current version uses Classic Pivot calculations from higher timeframes.
1. Daily, Weekly, and Monthly pivot levels are collected.
2. Nearby pivot levels are grouped into clusters when they fall within the active cluster width.
3. The script selects the nearest upper cluster and the nearest lower cluster relative to current price.
4. Each selected cluster is evaluated with a survival model.
The survival model is based on factors such as:
- cluster density
- higher-timeframe participation
- repeated tests
- rejection behavior
- inside-zone pressure
- breach frequency
- time since structural failure
A higher survival score suggests that the cluster has remained more durable under recent interaction. A higher pressure reading suggests that the cluster is experiencing more structural stress.
The chart display is intentionally selective. Instead of plotting every pivot line independently, the script concentrates on the nearest relevant clusters and presents them as zones with a backbone line and state label. This is designed to keep the structure readable.
States / Signals
The script uses state-based interpretation rather than directional promises.
Typical state classifications include:
- Stable
- Strengthening
- Balanced
- Under Stress
- Fragile
- Failed
These states are derived from the relationship between survival and pressure. They are meant to describe the condition of the cluster, not to issue a guaranteed trading outcome.
The panel summarizes:
- nearest upper cluster
- nearest lower cluster
- dominant survival side
- cluster pressure
- pivot mix currently included in the model
The script can also generate alert conditions for:
- cluster strengthening
- cluster failure
- cluster reclaim behavior
These alerts are deterministic conditions derived from the script logic. They are informational and should be interpreted within a broader market workflow.
Key Inputs
Pivot Formula
This version is intentionally limited to Classic Pivots in order to keep the clustering and scoring model consistent.
Include Daily / Weekly / Monthly
These settings control which higher-timeframe pivot families are included in the cluster engine.
Cluster ATR Width
Controls how aggressively nearby pivot levels are merged into the same cluster using ATR-based spacing.
Cluster Percent Width
Adds a percentage-based width floor so clusters remain practical across different price scales.
Minimum Levels Per Cluster
Controls how many pivot levels are required before a true cluster is recognized.
Survival Lookback
Defines the observation window used for the durability calculations.
Visual Controls
The script includes settings for cluster visibility, labels, backbone lines, panel location, and font sizes.
Limitations & Transparency
This script is a structural reading tool. It is not a prediction engine.
A high survival score does not guarantee that price will reverse, hold, or trend from that area. A low survival score does not guarantee immediate failure. The values should be read as condition metrics for pivot-derived zones.
Because the script groups pivot levels into clusters, output can vary depending on volatility, symbol characteristics, and timeframe context. On some symbols, one side may show a stronger cluster than the other. On some charts, one side may temporarily rely on a weaker fallback anchor when cluster density is limited.
This script does not attempt to replace market structure analysis, higher-timeframe context, liquidity analysis, or risk management. It is intended to organize pivot confluence into a readable survival framework.
What this script is not:
- not a buy/sell signal engine
- not a guarantee of support or resistance
- not a standalone trade system
- not a future-price prediction model
Risk Disclosure
This script is for chart analysis and decision support only. It does not provide financial, investment, or trading advice. Markets can move unpredictably, and no indicator can eliminate risk.
Users should evaluate signals, states, and cluster conditions together with their own process, timeframe alignment, and risk controls before making any decision.
發行說明
UPDATE NOTES - V1.2This update focuses on visual presentation, chart readability, and label balance.
The core purpose of the script remains the same: to map the nearest upper and lower pivot clusters and summarize how durable or fragile those zones appear based on the script’s internal survival model. This release does not reframe the tool as a prediction engine, and it does not change the script’s role as a structural decision-support overlay.
What changed
• Refined cluster zone presentation
The upper and lower cluster areas were visually reorganized to look cleaner and more intentional on the chart. The goal was to make nearby pivot concentration zones easier to identify at a glance while keeping the structure readable on active price charts.
• Improved label formatting
Cluster labels were compressed into a more compact two-line layout so the chart feels less crowded. This improves scanning speed and helps the script look more balanced when both upper and lower clusters are visible at the same time.
• Better label placement balance
Upper and lower labels were repositioned to create more breathing room around the active zones. This reduces visual friction near the right edge of the chart and makes the two cluster readouts easier to distinguish quickly.
• Cleaner visual hierarchy
The relationship between zone, backbone, and label was tightened so the displayed structure reads more clearly as one cluster object instead of separate disconnected elements.
• Panel presentation refined
The summary panel was kept compact and readable so the state view remains easy to scan without competing too aggressively with the main chart.
What did not change
• The script still uses its existing pivot-cluster framework.
• The survival and pressure logic remain in the same analytical role.
• The script still evaluates nearby upper and lower cluster behavior rather than issuing standalone trade instructions.
• The documented purpose of the alerts remains the same.
Why this update matters
This was a presentation-focused refinement intended to improve first-glance readability and overall chart quality. The script should now feel more polished without changing its structural interpretation model.
Limitations and transparency
This script organizes pivot-cluster context. It does not guarantee reaction quality, future direction, or trade outcome. Cluster strength and fragility should be interpreted in context with market structure, volatility, and user workflow.
Risk disclosure
This script is for chart analysis and educational use. It should not be treated as financial advice or as a standalone basis for entering or exiting any position.
發行說明
Update Notes - V1.3This update focuses on visual clarity, panel standardization, and cleaner cluster presentation.
What changed
- Refined the upper and lower cluster zone rendering for a cleaner chart appearance.
- Softened the cluster visuals so price candles remain easier to read during active zones.
- Added a more polished boundary structure to improve cluster definition without creating excess chart noise.
- Standardized the panel header layout to match the current AG Pro visual format.
- Updated the top panel row to a unified blue header with the script name only.
- Adjusted default panel text sizing for a more compact and consistent layout.
- Kept label sizing at a clearer normal-style default for better right-side readability.
- Improved overall panel contrast and row balance for dark and light chart usage.
- Cleaned up the label presentation so upper and lower cluster callouts look more structured.
- Preserved the original core logic while improving the visual delivery of the script.
Notes
- This update is primarily a presentation and readability refinement.
- The script remains an analytical chart tool built around pivot cluster behavior.
- It does not predict future price movement and should be used with broader market context.
發行說明
Update Notes - V2.0Version 2.0 focuses on clarity, stack identity, and stronger chart-side presentation without turning the script into a generic pivot or support/resistance overlay.
- Reframed the visual model around pivot stacks instead of simple pivot zones, which makes the concept more distinct from reaction-style and general level-survival tools.
- Added a new stack compression layer so tight multi-timeframe pivot clustering stands out immediately.
- Added pressure shelves on the first-contact edge of each active stack to make pressure build-up easier to read.
- Upgraded the chart styling to the AGPro palette with cleaner halo/core separation and stronger state-driven coloring.
- Moved the public title to the updated AGPro naming standard: no leading `AG Pro`, while the panel header still keeps AG Pro branding.
- Reduced clutter by removing the unused pivot-formula selector and keeping labels limited to one compact readout per side.
- Improved label placement with ATR-based spacing so labels stay visible instead of getting buried inside candles.
- Kept the merged blue panel header as the top-row standard and refreshed the panel with stronger stack, compression, pressure, and mix context.
- Preserved deterministic alert logic for strengthening, failure, and reclaim events while aligning alert text with the updated stack framing.
發行說明
UPDATE NOTES - v2.2This update focuses on readability and decision clarity.
The core purpose of the script remains unchanged.
This release improves how the existing clustering and survival logic is presented,
organized, and interpreted on the chart.
This script continues to function as an analytical and visualization tool.
It does not attempt to predict price direction or provide guaranteed outcomes.
------------------------
What Changed
------------------------
- Next Action readout
The panel now includes a plain-language Next Action line that translates the
dominant stack state, the pressure reading, and the current price position into
a single suggested response (for example Fade Upper - Resistance Firm, Defend
Lower - Support Firm, Breakout Watch - Resistance Weak, or Stand Aside -
Structure Fragile). It turns the existing scores into a clear at-a-glance
read of how the structure is behaving right now.
- Stack badges
Each active stack carries a single compact badge showing its state and survival
score. When only one stack is shown the badge is centered inside its zone. When
both stacks are shown, the upper badge is placed above its zone and the lower
badge below its zone, so the two badges stay clearly separated and never overlap
even when the upper and lower pivot stacks sit at nearby prices. Badges live in
the forward projection so they stay clear of the candles.
- Cleaner zone hierarchy
Boundary lines are now off by default so each stack reads as a clean band
(halo, core, pressure shelf, and backbone) instead of a stack of overlapping
lines. The exact boundaries can still be re-enabled from the Visuals group.
- Adaptive text color
Badge and panel value text color is now selected automatically from the
background brightness, keeping every readout legible across the full palette
and both themes.
- Panel labelling
Panel rows were reordered so the Next Action sits directly under the header,
followed by the upper, lower, and dominant stack context.
------------------------
Visual Improvements
------------------------
- Improved chart readability by replacing the corner labels with centered,
state-colored stack badges.
- Reduced visual clutter by turning boundary lines off by default and letting
the zone fills convey each stack's extent.
- Refined visual hierarchy so the dominant stack and the suggested response are
the first things the eye lands on.
- Adjusted badge positioning into the forward projection to avoid overlap with
candles.
------------------------
Interface & Usability
------------------------
- Optimized panel layout with a dedicated Next Action row for clearer
information flow.
- Improved badge readability and adaptive contrast for cleaner chart interaction.
- Adjusted default visual settings for a more balanced first-glance appearance.
- Enhanced overall user experience without changing core logic.
------------------------
Behavior Notes
------------------------
This update does not change the core analytical logic of the script.
The multi-timeframe pivot clustering, compression scoring, survival scoring, and
pressure reading all behave exactly as before. The Next Action line is a plain
-language summary of those existing outputs; it is not a new signal layer.
Users should interpret outputs the same way as before, but with improved visual
structure and a clearer suggested response.
------------------------
Limitations Reminder
------------------------
The script remains a rule-based analytical tool.
Market conditions such as volatility, liquidity, and timeframe differences may
affect how clusters form and how survival and pressure read.
Outputs and the Next Action line should always be interpreted within broader
market context.
------------------------
Risk Reminder
------------------------
This script is for educational and analytical purposes only.
It does not provide financial advice or guaranteed trading outcomes.
Users remain responsible for their own decisions.
開源腳本
秉持TradingView一貫精神,這個腳本的創作者將其設為開源,以便交易者檢視並驗證其功能。向作者致敬!您可以免費使用此腳本,但請注意,重新發佈代碼需遵守我們的社群規範。

Public-free scripts + invite-only AGPro workflows for market analysis, liquidity context, risk planning and execution review.
Rules-based. No hype. No guesswork.
Library & access: agprolabs.com/
Telegram: t.me/agprolabs
Rules-based. No hype. No guesswork.
Library & access: agprolabs.com/
Telegram: t.me/agprolabs
免責聲明
這些資訊和出版物並非旨在提供,也不構成TradingView提供或認可的任何形式的財務、投資、交易或其他類型的建議或推薦。請閱讀使用條款以了解更多資訊。
開源腳本
秉持TradingView一貫精神,這個腳本的創作者將其設為開源,以便交易者檢視並驗證其功能。向作者致敬!您可以免費使用此腳本,但請注意,重新發佈代碼需遵守我們的社群規範。
Public-free scripts + invite-only AGPro workflows for market analysis, liquidity context, risk planning and execution review.
Rules-based. No hype. No guesswork.
Library & access: agprolabs.com/
Telegram: t.me/agprolabs
Rules-based. No hype. No guesswork.
Library & access: agprolabs.com/
Telegram: t.me/agprolabs
免責聲明
這些資訊和出版物並非旨在提供,也不構成TradingView提供或認可的任何形式的財務、投資、交易或其他類型的建議或推薦。請閱讀使用條款以了解更多資訊。