RSI of Ratio
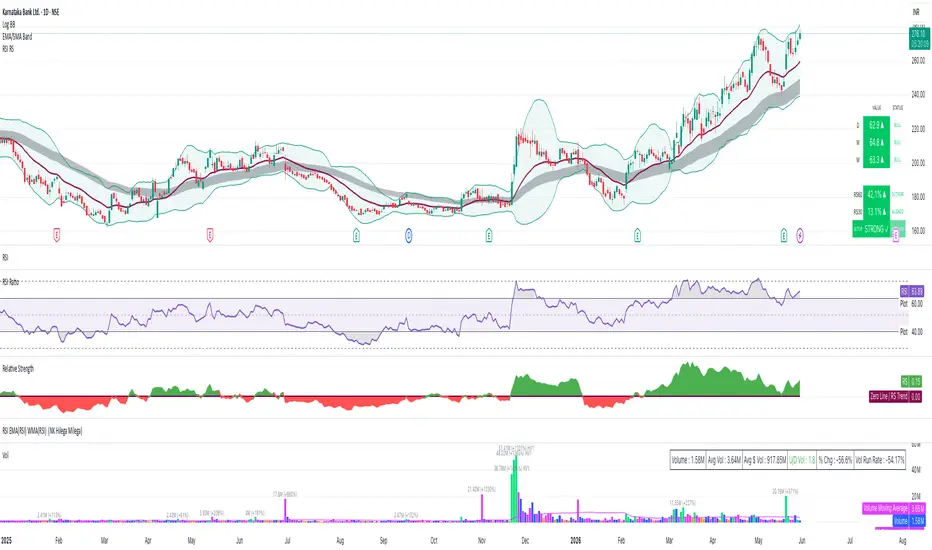
What it does:
Calculates RSI on the ratio of current symbol vs a user-selected compare symbol
(default: NSE:NIFTY). This shows whether the stock is strong or weak relative
to the index.
How to use:
- RSI above 60 → stock outperforming the index (gray dark fill)
- RSI 50–60 → mildly outperforming
- RSI 40–50 → mildly underperforming
- RSI below 40 → stock underperforming the index (gray dark fill)
Settings:
- RSI Length: default 30
- Compare Symbol: any TradingView symbol (Nifty, BTC, SPX, Gold etc)
- All levels adjustable: 70/60/50/40/30
Calculates RSI on the ratio of current symbol vs a user-selected compare symbol
(default: NSE:NIFTY). This shows whether the stock is strong or weak relative
to the index.
How to use:
- RSI above 60 → stock outperforming the index (gray dark fill)
- RSI 50–60 → mildly outperforming
- RSI 40–50 → mildly underperforming
- RSI below 40 → stock underperforming the index (gray dark fill)
Settings:
- RSI Length: default 30
- Compare Symbol: any TradingView symbol (Nifty, BTC, SPX, Gold etc)
- All levels adjustable: 70/60/50/40/30

免責聲明
這些資訊和出版物並非旨在提供,也不構成TradingView提供或認可的任何形式的財務、投資、交易或其他類型的建議或推薦。請閱讀使用條款以了解更多資訊。
免責聲明
這些資訊和出版物並非旨在提供,也不構成TradingView提供或認可的任何形式的財務、投資、交易或其他類型的建議或推薦。請閱讀使用條款以了解更多資訊。