Equal Highs & Lows + Volume Profile
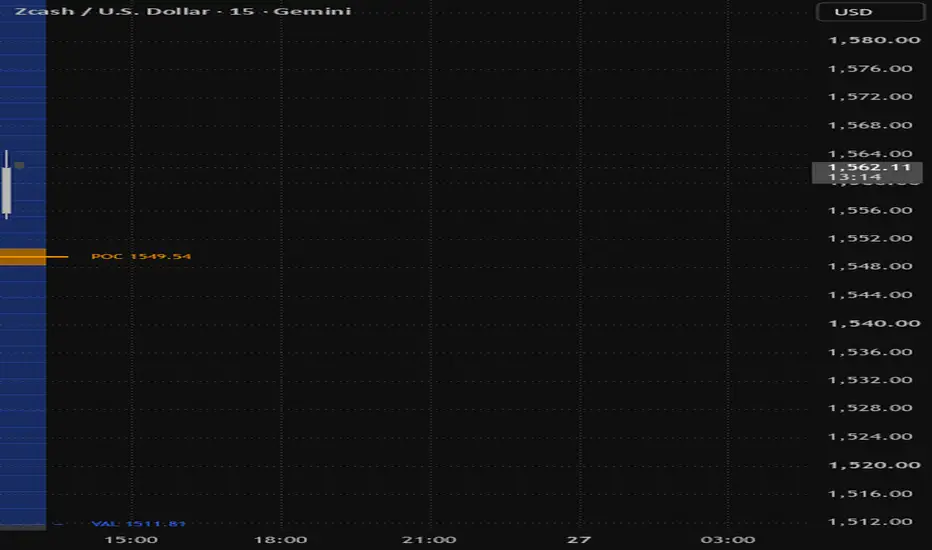
Equal Highs & Lows + Volume Profile
Two tools that answer the same question from opposite directions: where is price likely to react, and why. Equal highs and lows mark the resting liquidity on the chart itself. The volume profile on the right shows where the business actually got done.
Equal highs and equal lows
A single swing high is a level. Two swings that print at effectively the same price is engineered liquidity, because stops stack between them and above them, and that is what gets targeted.
So this draws nothing for a lone swing. Every confirmed pivot goes into a waiting list, invisible. Only when a second swing lands within tolerance of a waiting one does the pair become a level, and at that moment one line replaces the two, tagged EQH or EQL. Your chart stays empty except where the pattern genuinely exists.
If a third or fourth swing joins the same level, the tag updates to EQH x3 and the line thickens, because that is one pool of orders getting deeper rather than several separate levels.
Lines extend to the right until price trades through them. Once taken, the line dims and stops at the bar that swept it, so at any moment the bright lines are the liquidity still sitting on the chart and the faded ones are the record of what has already been run.
Two rules keep it honest. Waiting levels expire after a set number of bars, because a high from four hundred bars ago is not pairing with anything meaningful today. And a waiting level is dropped the moment price trades through it, so a swing that was taken out before finding a partner can never come back later to form a false pair.
Volume profile
Built from the lookback window and drawn as a horizontal histogram anchored past the last bar, clear of price.
Each bar's volume is distributed across every row its range covers rather than dumped at the closing price. That matters. A profile that assigns a whole bar's volume to one price is not describing where trading happened, and on wide bars the difference is severe.
The value area is calculated properly rather than approximated. It starts at the point of control and expands outward one row at a time, always taking the heavier neighbouring row, until it has captured the target share of total volume. The point of control, value area high and value area low are drawn across the lookback window with their prices labelled, and rows inside the value area are coloured distinctly from those outside.
An optional split shows how much of each row traded on up bars against down bars, which is useful for seeing where one side did the work.
Settings
Equality tolerance is the main control for the levels. It is measured as a percentage of ATR, so it scales across instruments and timeframes without retuning. Raise it if obvious equal highs on your chart are being missed, lower it if unrelated levels are being joined.
Swing length sets how significant a pivot must be before it counts. Minimum bars apart stops two swings from the same cluster registering as a pair, so you can demand a genuine return to the level.
Break trigger chooses whether a wick through the level counts as taken or whether only a body close does.
For the profile, rows and lookback control resolution against speed. Width, gap and transparency control how it sits next to price. Value area percentage defaults to the conventional seventy.
Notes
Pivots confirm after the swing completes, so a level appears on the chart some bars after the swings that formed it. The line is drawn back to the correct bar, but it cannot exist before the second pivot is confirmed.
The volume profile requires volume data from your feed. It is rebuilt on the last bar and updates live.
This is a levels and context tool. It does not generate entries, exits or directional signals, and makes no claim about what price will do at any level it draws.
Want a short version for the one-line summary field?
wait update the code i cant see the vp
Almost certainly it's drawing about 100 bars into the future, past the right edge of your visible chart. Also, ta.highest(high, 300) returns na until the chart has 300 bars, which kills it entirely on shorter history. Fixing both.
That's the Eq type's own x0 field, unrelated to the local I removed. Placement math confirms the overlay now sits over the last ~60 bars instead of 100 bars into empty space.
Two reasons it was invisible, both fixed.
It was drawing off-screen. The profile started 6 bars past the last candle and extended up to 90 bars further right, into empty space your chart doesn't show unless you scroll. There's now a Placement setting defaulting to "Overlay on price", which anchors the profile at the last bar and grows it leftward across your recent candles, the way TradingView's own visible-range profile sits. It can't be off-screen. "Right of price" is still there if you prefer the clean look and don't mind scrolling.
It needed 300 bars of history to draw anything at all. ta.highest(high, 300) returns nothing until the chart has 300 bars, so on shorter history the whole block was skipped silently. The range is now measured directly over whatever bars actually exist, so it renders on any chart.
I also made it tell you when it can't work: if the symbol has no volume data, you now get a label saying so instead of an empty chart that looks broken.
Width dropped to 60 bars and the gap to 2, which sits better in overlay mode. If it covers too much price action, lower the width or raise the transparency.
Two tools that answer the same question from opposite directions: where is price likely to react, and why. Equal highs and lows mark the resting liquidity on the chart itself. The volume profile on the right shows where the business actually got done.
Equal highs and equal lows
A single swing high is a level. Two swings that print at effectively the same price is engineered liquidity, because stops stack between them and above them, and that is what gets targeted.
So this draws nothing for a lone swing. Every confirmed pivot goes into a waiting list, invisible. Only when a second swing lands within tolerance of a waiting one does the pair become a level, and at that moment one line replaces the two, tagged EQH or EQL. Your chart stays empty except where the pattern genuinely exists.
If a third or fourth swing joins the same level, the tag updates to EQH x3 and the line thickens, because that is one pool of orders getting deeper rather than several separate levels.
Lines extend to the right until price trades through them. Once taken, the line dims and stops at the bar that swept it, so at any moment the bright lines are the liquidity still sitting on the chart and the faded ones are the record of what has already been run.
Two rules keep it honest. Waiting levels expire after a set number of bars, because a high from four hundred bars ago is not pairing with anything meaningful today. And a waiting level is dropped the moment price trades through it, so a swing that was taken out before finding a partner can never come back later to form a false pair.
Volume profile
Built from the lookback window and drawn as a horizontal histogram anchored past the last bar, clear of price.
Each bar's volume is distributed across every row its range covers rather than dumped at the closing price. That matters. A profile that assigns a whole bar's volume to one price is not describing where trading happened, and on wide bars the difference is severe.
The value area is calculated properly rather than approximated. It starts at the point of control and expands outward one row at a time, always taking the heavier neighbouring row, until it has captured the target share of total volume. The point of control, value area high and value area low are drawn across the lookback window with their prices labelled, and rows inside the value area are coloured distinctly from those outside.
An optional split shows how much of each row traded on up bars against down bars, which is useful for seeing where one side did the work.
Settings
Equality tolerance is the main control for the levels. It is measured as a percentage of ATR, so it scales across instruments and timeframes without retuning. Raise it if obvious equal highs on your chart are being missed, lower it if unrelated levels are being joined.
Swing length sets how significant a pivot must be before it counts. Minimum bars apart stops two swings from the same cluster registering as a pair, so you can demand a genuine return to the level.
Break trigger chooses whether a wick through the level counts as taken or whether only a body close does.
For the profile, rows and lookback control resolution against speed. Width, gap and transparency control how it sits next to price. Value area percentage defaults to the conventional seventy.
Notes
Pivots confirm after the swing completes, so a level appears on the chart some bars after the swings that formed it. The line is drawn back to the correct bar, but it cannot exist before the second pivot is confirmed.
The volume profile requires volume data from your feed. It is rebuilt on the last bar and updates live.
This is a levels and context tool. It does not generate entries, exits or directional signals, and makes no claim about what price will do at any level it draws.
Want a short version for the one-line summary field?
wait update the code i cant see the vp
Almost certainly it's drawing about 100 bars into the future, past the right edge of your visible chart. Also, ta.highest(high, 300) returns na until the chart has 300 bars, which kills it entirely on shorter history. Fixing both.
That's the Eq type's own x0 field, unrelated to the local I removed. Placement math confirms the overlay now sits over the last ~60 bars instead of 100 bars into empty space.
Two reasons it was invisible, both fixed.
It was drawing off-screen. The profile started 6 bars past the last candle and extended up to 90 bars further right, into empty space your chart doesn't show unless you scroll. There's now a Placement setting defaulting to "Overlay on price", which anchors the profile at the last bar and grows it leftward across your recent candles, the way TradingView's own visible-range profile sits. It can't be off-screen. "Right of price" is still there if you prefer the clean look and don't mind scrolling.
It needed 300 bars of history to draw anything at all. ta.highest(high, 300) returns nothing until the chart has 300 bars, so on shorter history the whole block was skipped silently. The range is now measured directly over whatever bars actually exist, so it renders on any chart.
I also made it tell you when it can't work: if the symbol has no volume data, you now get a label saying so instead of an empty chart that looks broken.
Width dropped to 60 bars and the gap to 2, which sits better in overlay mode. If it covers too much price action, lower the width or raise the transparency.

免責聲明
這些資訊和出版物並非旨在提供,也不構成TradingView提供或認可的任何形式的財務、投資、交易或其他類型的建議或推薦。請閱讀使用條款以了解更多資訊。