OPEN-SOURCE SCRIPT
GBR Smart Volume Delta [Absorption & Traps]
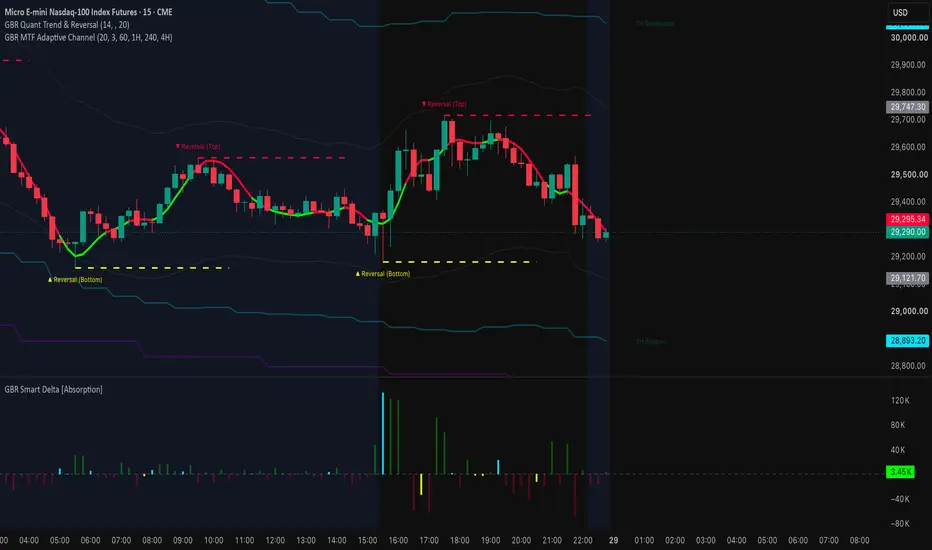
The traditional Volume Delta indicator is fundamentally flawed for modern day trading. It only calculates aggressive market orders, completely blinding you to the passive institutional limit orders (icebergs) that actually stop the price.
The GBR Smart Delta doesn't just count orders; it thinks. It analyzes the relationship between raw delta and the actual candlestick close to detect Institutional Absorption in real-time.
🔥 Core Features & Visual Logic:
Trap Detection: Exposes moments when retail traders are aggressively selling, but the price refuses to drop (or leaves a massive wick).
💥 UV Yellow (Bear Trap / Bullish Absorption): Delta is negative (heavy selling), but the candle closes bullish or forms a hammer. Passive buyers are absorbing the selling pressure. Prime long opportunity.
💥 UV Cyan (Bull Trap / Bearish Absorption): Delta is positive (heavy buying), but the candle closes bearish or forms a shooting star. Passive sellers have built a wall. Prime short opportunity.
Faint Colors for Normalcy: When price and volume agree, the histogram uses muted Green (70% transparent) and muted Red to keep your focus strictly on the anomalies.
Zero Clutter: No moving averages on the volume, no unnecessary lines. Just raw data and high-visibility trap signals.
🎯 How to execute:
Never trade delta in a vacuum. Wait for price to reach a major Support/Resistance level. If you see a bright UV Yellow or UV Cyan spike at these key structural zones, you know the Smart Money has stepped in. Enter with them.
The GBR Smart Delta doesn't just count orders; it thinks. It analyzes the relationship between raw delta and the actual candlestick close to detect Institutional Absorption in real-time.
🔥 Core Features & Visual Logic:
Trap Detection: Exposes moments when retail traders are aggressively selling, but the price refuses to drop (or leaves a massive wick).
💥 UV Yellow (Bear Trap / Bullish Absorption): Delta is negative (heavy selling), but the candle closes bullish or forms a hammer. Passive buyers are absorbing the selling pressure. Prime long opportunity.
💥 UV Cyan (Bull Trap / Bearish Absorption): Delta is positive (heavy buying), but the candle closes bearish or forms a shooting star. Passive sellers have built a wall. Prime short opportunity.
Faint Colors for Normalcy: When price and volume agree, the histogram uses muted Green (70% transparent) and muted Red to keep your focus strictly on the anomalies.
Zero Clutter: No moving averages on the volume, no unnecessary lines. Just raw data and high-visibility trap signals.
🎯 How to execute:
Never trade delta in a vacuum. Wait for price to reach a major Support/Resistance level. If you see a bright UV Yellow or UV Cyan spike at these key structural zones, you know the Smart Money has stepped in. Enter with them.
開源腳本
秉持TradingView一貫精神,這個腳本的創作者將其設為開源,以便交易者檢視並驗證其功能。向作者致敬!您可以免費使用此腳本,但請注意,重新發佈代碼需遵守我們的社群規範。

免責聲明
這些資訊和出版物並非旨在提供,也不構成TradingView提供或認可的任何形式的財務、投資、交易或其他類型的建議或推薦。請閱讀使用條款以了解更多資訊。
免責聲明
這些資訊和出版物並非旨在提供,也不構成TradingView提供或認可的任何形式的財務、投資、交易或其他類型的建議或推薦。請閱讀使用條款以了解更多資訊。