OPEN-SOURCE SCRIPT
Pure CVD MACD (Momentum of Delta)
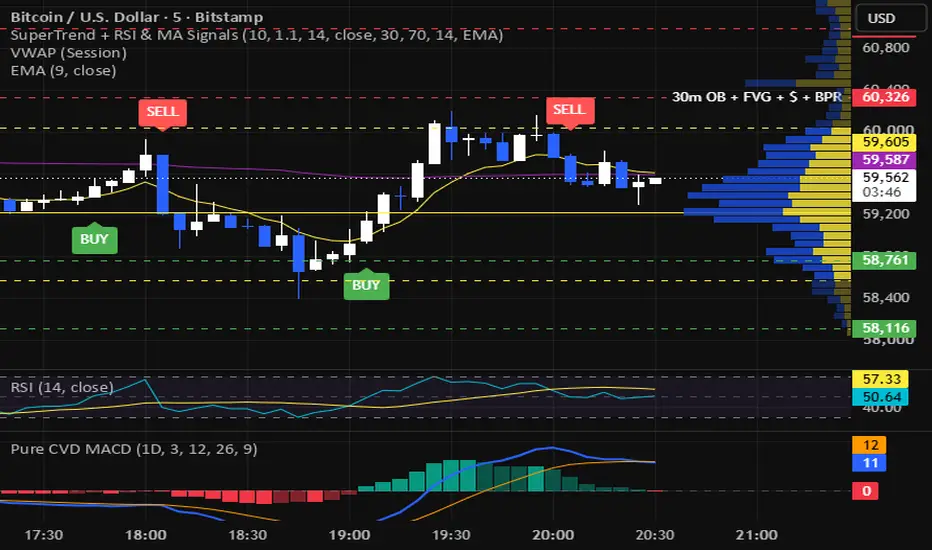
Overview
Traditional MACD indicators are fantastic at measuring the momentum of price, but they are entirely blind to the actual order flow driving that price. The Pure CVD MACD shifts the focus from the result (price action) to the cause (market aggression).
Instead of asking "Are there more buyers or sellers?", this indicator asks "Is the buying or selling pressure accelerating or decelerating?"
Built using Pine Script Version 6 and the new ta.requestVolumeDelta function, this script calculates a classic MACD (Moving Average Convergence Divergence) entirely on the raw Cumulative Volume Delta (CVD), completely independent of price. This provides an institutional-grade look at the momentum of order flow.
How It Works
The script calculates a continuous Cumulative Volume Delta line by scanning lower timeframe data to find the exact net difference between buying and selling volume. It then applies standard MACD logic to that CVD line:
MACD Line (Blue): The difference between a Fast EMA and Slow EMA of the volume delta.
Signal Line (Orange): An EMA of the MACD Line itself.
Histogram: The visual difference between the MACD Line and the Signal Line, color-coded to show momentum shifts.
Key Order Flow Concepts to Trade
Momentum Shifts (Zero-Line Crossovers): When the histogram crosses above the zero line (Blue crosses over Orange), the volume delta is gaining bullish momentum. Even if the macro trend is down, this shows aggressive buyers are stepping in and accelerating their pace. A cross below zero signals accelerating bearish pressure.
Exhaustion (Histogram Fades): Watch for the color fades (Teal to Dark Teal, or Red to Dark Red). If you are watching a massive sell-off and the histogram prints a "Dark Red" bar, the selling pressure is decelerating. Sellers are running out of ammunition, often signaling an impending reversal.
Hidden Divergence: Compare the Pure CVD MACD to the price chart. If the price is grinding upward to make a Higher High, but the CVD MACD is crossing bearishly below its Signal Line, the breakout is running on fumes and a trap is likely being set.
Settings Breakdown
Anchor & Lower Timeframe: Defines the starting point for the cumulative delta and the timeframe used to calculate the intra-bar buying/selling volume. By default, it automatically selects the best lower timeframe.
Fast / Slow EMA Lengths (Default 12, 26): The lookback periods used to track the short-term vs. long-term trend of the volume delta.
Signal EMA Length (Default 9): The trigger line used to spot early momentum shifts in the delta.
Best Practices
Because this indicator measures the momentum of order flow rather than absolute volume, it pairs exceptionally well with structural price analysis or liquidity zones. When price taps a major support level and the Pure CVD MACD prints a bullish divergence or a histogram fade, you have highly confluent evidence that the level will hold.
Traditional MACD indicators are fantastic at measuring the momentum of price, but they are entirely blind to the actual order flow driving that price. The Pure CVD MACD shifts the focus from the result (price action) to the cause (market aggression).
Instead of asking "Are there more buyers or sellers?", this indicator asks "Is the buying or selling pressure accelerating or decelerating?"
Built using Pine Script Version 6 and the new ta.requestVolumeDelta function, this script calculates a classic MACD (Moving Average Convergence Divergence) entirely on the raw Cumulative Volume Delta (CVD), completely independent of price. This provides an institutional-grade look at the momentum of order flow.
How It Works
The script calculates a continuous Cumulative Volume Delta line by scanning lower timeframe data to find the exact net difference between buying and selling volume. It then applies standard MACD logic to that CVD line:
MACD Line (Blue): The difference between a Fast EMA and Slow EMA of the volume delta.
Signal Line (Orange): An EMA of the MACD Line itself.
Histogram: The visual difference between the MACD Line and the Signal Line, color-coded to show momentum shifts.
Key Order Flow Concepts to Trade
Momentum Shifts (Zero-Line Crossovers): When the histogram crosses above the zero line (Blue crosses over Orange), the volume delta is gaining bullish momentum. Even if the macro trend is down, this shows aggressive buyers are stepping in and accelerating their pace. A cross below zero signals accelerating bearish pressure.
Exhaustion (Histogram Fades): Watch for the color fades (Teal to Dark Teal, or Red to Dark Red). If you are watching a massive sell-off and the histogram prints a "Dark Red" bar, the selling pressure is decelerating. Sellers are running out of ammunition, often signaling an impending reversal.
Hidden Divergence: Compare the Pure CVD MACD to the price chart. If the price is grinding upward to make a Higher High, but the CVD MACD is crossing bearishly below its Signal Line, the breakout is running on fumes and a trap is likely being set.
Settings Breakdown
Anchor & Lower Timeframe: Defines the starting point for the cumulative delta and the timeframe used to calculate the intra-bar buying/selling volume. By default, it automatically selects the best lower timeframe.
Fast / Slow EMA Lengths (Default 12, 26): The lookback periods used to track the short-term vs. long-term trend of the volume delta.
Signal EMA Length (Default 9): The trigger line used to spot early momentum shifts in the delta.
Best Practices
Because this indicator measures the momentum of order flow rather than absolute volume, it pairs exceptionally well with structural price analysis or liquidity zones. When price taps a major support level and the Pure CVD MACD prints a bullish divergence or a histogram fade, you have highly confluent evidence that the level will hold.
開源腳本
秉持TradingView一貫精神,這個腳本的創作者將其設為開源,以便交易者檢視並驗證其功能。向作者致敬!您可以免費使用此腳本,但請注意,重新發佈代碼需遵守我們的社群規範。

免責聲明
這些資訊和出版物並非旨在提供,也不構成TradingView提供或認可的任何形式的財務、投資、交易或其他類型的建議或推薦。請閱讀使用條款以了解更多資訊。
開源腳本
秉持TradingView一貫精神,這個腳本的創作者將其設為開源,以便交易者檢視並驗證其功能。向作者致敬!您可以免費使用此腳本,但請注意,重新發佈代碼需遵守我們的社群規範。
免責聲明
這些資訊和出版物並非旨在提供,也不構成TradingView提供或認可的任何形式的財務、投資、交易或其他類型的建議或推薦。請閱讀使用條款以了解更多資訊。