OPEN-SOURCE SCRIPT
MAHQuant_IND_WeeklyDailyHL_v1.0
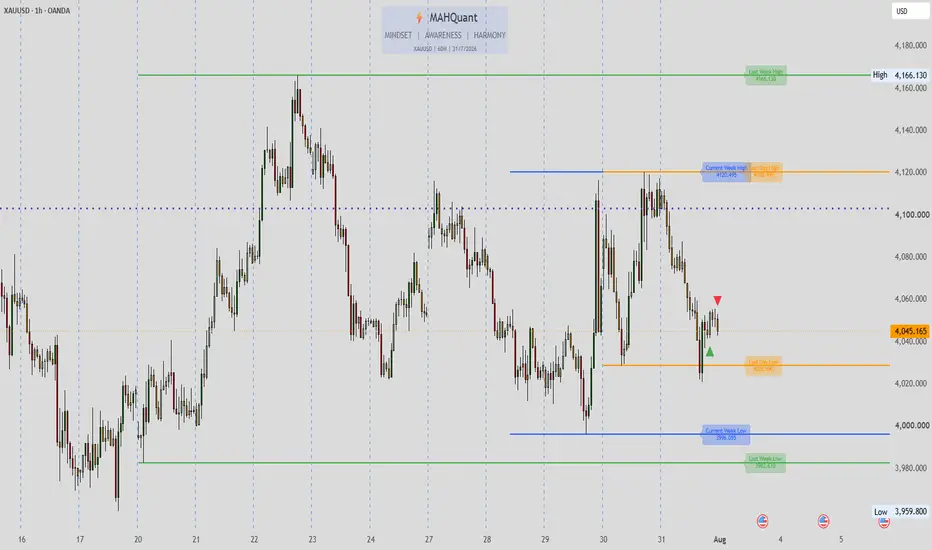
MAHQuant Weekly & Daily High-Low Levels
A professional price action indicator that automatically draws the previous week's and day's High/Low levels, as well as the current week's (Monday-Wednesday) range. It also includes a candle comparison feature to detect potential reversal signals.
🧠 HOW IT WORKS:
Weekly Levels (Previous Week):
• Retrieves the highest and lowest prices from the previous full trading week using request.security("W", ...)
• Draws horizontal lines at those levels
• Includes adjustable percentage offsets to create buffer zones
• Labels display the exact price value
Daily Levels (Previous Day):
• Retrieves the highest and lowest prices from the previous trading day using request.security("D", ...)
• Draws horizontal lines at those levels
• Includes adjustable percentage offsets
• Labels display the exact price value
Current Week Levels (Monday - Wednesday):
• Tracks the high and low from Monday, Tuesday, and Wednesday separately
• After Wednesday close, calculates the highest high and lowest low among these 3 days
• Draws a single range line for the entire current week
• Extends to the right for forward-looking reference
Candle Comparison Logic:
• Compares the current candle's wick size to the previous candle's wick size
• Identifies when the current candle is opposite in direction (e.g., red after green)
• Highlights when the current candle's wick is larger than the previous candle's wick
• This helps spot potential rejection or reversal patterns
Bar Coloring Logic:
• Green: Bullish candle with large body and high volume
• Light Green: Bullish candle with small body or low volume
• Red: Bearish candle with large body and high volume
• Orange: Bearish candle with small body or low volume
⚙️ HOW TO USE:
1. Set your broker's timezone in the "Timezone" input
2. Toggle Weekly/Daily/Current Week levels on/off
3. Adjust the offset percentages to create buffer zones
4. Enable "Candle Comparison" to spot rejection signals
⚠️ DISCLAIMER:
This script is for educational purposes only. Not financial advice. Past performance does not guarantee future results.
📌 VERSION: 1.0 | DEVELOPER: MAHQuant | UPDATED: August 2026
🙏 Special thanks to Mr. Amirreza Arya for his valuable educational insights that inspired this tool.
開源腳本
秉持TradingView一貫精神,這個腳本的創作者將其設為開源,以便交易者檢視並驗證其功能。向作者致敬!您可以免費使用此腳本,但請注意,重新發佈代碼需遵守我們的社群規範。

Telegram: t.me/MAHQuantTradingSystem
TikTok: tiktok.com/@mahquant?_r=1&_t=ZS-99XOUB9EXLw
TikTok: tiktok.com/@mahquant?_r=1&_t=ZS-99XOUB9EXLw
免責聲明
這些資訊和出版物並非旨在提供,也不構成TradingView提供或認可的任何形式的財務、投資、交易或其他類型的建議或推薦。請閱讀使用條款以了解更多資訊。
開源腳本
秉持TradingView一貫精神,這個腳本的創作者將其設為開源,以便交易者檢視並驗證其功能。向作者致敬!您可以免費使用此腳本,但請注意,重新發佈代碼需遵守我們的社群規範。
免責聲明
這些資訊和出版物並非旨在提供,也不構成TradingView提供或認可的任何形式的財務、投資、交易或其他類型的建議或推薦。請閱讀使用條款以了解更多資訊。