OPEN-SOURCE SCRIPT
Market Crash Barometer AB
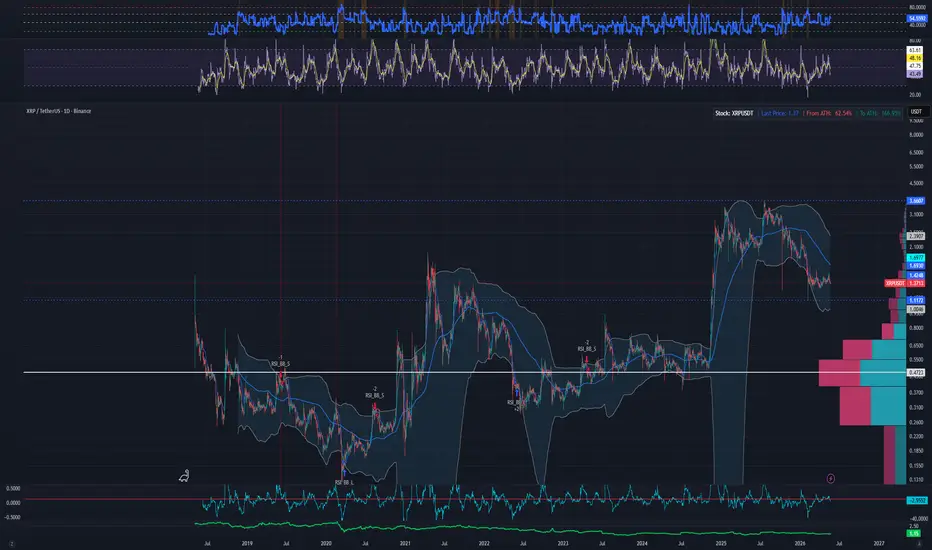
Market Crash Barometer by AB
The Market Crash Barometer is a multi-factor risk indicator designed to measure overall market stress and identify conditions that commonly appear before sharp market selloffs or panic events.
Instead of relying on a single signal, this indicator combines six key market factors into one unified Crash Score (0–100):
The combined score creates a real-time stress gauge that helps traders quickly assess whether markets are calm, weakening, or entering panic conditions.
Crash Score Zones
Background colors automatically highlight extreme risk environments:
Notes
This indicator is not intended to predict exact market tops or crashes. Instead, it acts as a probabilistic warning system by combining volatility, momentum, trend, and participation metrics into a single easy-to-read framework.
Works best when combined with price action and broader market analysis.
The Market Crash Barometer is a multi-factor risk indicator designed to measure overall market stress and identify conditions that commonly appear before sharp market selloffs or panic events.
Instead of relying on a single signal, this indicator combines six key market factors into one unified Crash Score (0–100):
- VIX Fear Index – Measures volatility and market fear
- Trend Strength – Detects when price trades below the 200-period moving average
- RSI Weakness – Identifies deteriorating momentum
- MACD Momentum – Confirms bearish momentum shifts
- Volume Expansion – Highlights abnormal trading activity
- ATR Volatility – Tracks rising market instability
The combined score creates a real-time stress gauge that helps traders quickly assess whether markets are calm, weakening, or entering panic conditions.
Crash Score Zones
- 0–25 → Normal Conditions
- 25–45 → Caution
- 45–65 → Stress
- 65–80 → Panic
- 80+ → Elevated Crash Risk
Background colors automatically highlight extreme risk environments:
- Orange = Panic conditions
- Red = Severe crash risk
- Best Uses
- Risk management
- Market regime detection
- Confirming bearish setups
- Identifying high-volatility environments
- Timing defensive positioning
Pine Script® Pine Script® Pine Script®
Notes
This indicator is not intended to predict exact market tops or crashes. Instead, it acts as a probabilistic warning system by combining volatility, momentum, trend, and participation metrics into a single easy-to-read framework.
Works best when combined with price action and broader market analysis.
開源腳本
秉持TradingView一貫精神,這個腳本的創作者將其設為開源,以便交易者檢視並驗證其功能。向作者致敬!您可以免費使用此腳本,但請注意,重新發佈代碼需遵守我們的社群規範。

免責聲明
這些資訊和出版物並非旨在提供,也不構成TradingView提供或認可的任何形式的財務、投資、交易或其他類型的建議或推薦。請閱讀使用條款以了解更多資訊。
開源腳本
秉持TradingView一貫精神,這個腳本的創作者將其設為開源,以便交易者檢視並驗證其功能。向作者致敬!您可以免費使用此腳本,但請注意,重新發佈代碼需遵守我們的社群規範。
免責聲明
這些資訊和出版物並非旨在提供,也不構成TradingView提供或認可的任何形式的財務、投資、交易或其他類型的建議或推薦。請閱讀使用條款以了解更多資訊。