策略
RVol %█ OVERVIEW
RVol % measures today's volume as a percentage of the 30-day average volume, displayed directly on your chart. It helps you instantly gauge whether current trading activity is unusually high, normal, or quiet - a critical piece of context for validating breakouts, spotting institutional activity, and filtering out low-conviction moves.
█ WHY RELATIVE VOLUME MATTERS
Raw volume numbers are hard to interpret on their own. 5 million shares on AAPL is a slow day; on a small cap, it's enormous. Relative Volume (RVol) solves this by expressing today's volume as a percentage of its recent average, giving you a normalized, comparable metric across any instrument.
🔴 RVol > 150% - Unusually high activity. Something is driving interest: earnings, news, institutional positioning. Price moves on high RVol tend to be more reliable.
🟠 RVol 100–150% - Normal to slightly elevated. Confirms steady participation.
⚪ RVol < 100% - Below-average interest. Breakouts on low RVol are more likely to fail. Ranges may persist.
█ FEATURES
⬜ Multi-Timeframe Accuracy
The indicator always calculates volume from the daily timeframe, regardless of your chart resolution. Whether you're on a 1-minute or weekly chart, the RVol reading reflects the true daily figure compared to the 30-day daily average.
⬜ Session Filtering
Toggle "Regular Session Only" to exclude pre-market and after-hours volume from the calculation. This gives you a cleaner read on participation during the main trading session.
⬜ On-Chart Labels (fully customizable, can be toggled on/off)
Configurable labels appear at the first bar of each session showing the RVol percentage. You can control visibility, history depth (last N days), size, position (above/below bars), background color, and vertical offset.
⬜ Volume Heatmap Background
An optional color-shaded background highlights the volume regime across the chart. Transparency is adjustable so it doesn't interfere with your price action analysis.
⬜ VWAP on High-Volume Days
When RVol exceeds a configurable threshold (default: 150%), the indicator automatically plots an intraday VWAP line. VWAP is a key reference for institutional traders - showing it only on high-volume days keeps your chart clean while highlighting the sessions where it matters most.
⬜ Alert System
Built-in alert conditions let you get notified without watching the chart:
🔔 RVol Extreme - Fires when volume exceeds the high threshold (default: 200%)
🔔 RVol Elevated - Fires when volume exceeds the mid threshold (default: 150%)
🔔 Low Previous Day - Flags sessions following a below-average volume day
Set these up through TradingView's standard Alerts menu to receive push, email, or webhook notifications.
⬜ Info Panel
A compact table in the top-right corner displays the current RVol %, today's raw volume, the 30-day average volume, and the active session mode (Regular / Full).
█ SETTINGS
Calculation
🔹 Average Length (default: 30) - Number of days for the volume moving average
🔹 Regular Session Only (default: On) - Exclude pre/post market volume
Alerts
🔹 Alert Threshold High (default: 200%) - Trigger level for extreme volume alert
🔹 Alert Threshold Mid (default: 150%) - Trigger level for elevated volume alert
Labels
🔹 Show Labels (default: On) - Display RVol labels on chart
🔹 Show Last N Days (default: 5) - Number of historical labels to display
🔹 Label Size (default: Normal) - tiny / small / normal / large / huge
🔹 Label Position (default: Top) - Above or below price bars
🔹 Show Label Background (default: On) - Color background behind label text
Colors and Thresholds
🔹 High Volume Threshold (default: 150%) - Color breakpoint for high activity
🔹 Mid Volume Threshold (default: 100%) - Color breakpoint for normal activity
Heatmap
🔹 Show Heatmap Background (default: On) - Volume-based chart shading
🔹 Heatmap Transparency (default: 90) - 0 = opaque, 100 = invisible
VWAP
🔹 Show VWAP (default: On) - Plot VWAP line on high-volume days
🔹 VWAP Trigger Threshold (default: 150%) - Minimum RVol to activate VWAP
█ HOW TO USE
Breakout confirmation: When price breaks a key level, check the RVol label. Above 150% adds conviction; below 80% is a warning sign.
Spotting unusual activity : A sudden spike to 200%+ with no obvious news can signal institutional accumulation or distribution before a move.
Intraday monitoring: The label updates in real time throughout the session. If RVol is building fast early in the day, it often signals a trending session ahead.
VWAP as a magnet: On high-volume days, price tends to revert toward VWAP. Use the auto-plotted VWAP as a reference for mean-reversion entries or as dynamic support/resistance.
█ NOTES
On intraday timeframes, the daily volume accumulates throughout the session, so the RVol percentage will naturally rise as the day progresses. The final value is only confirmed at session close.
The 30-day average uses a simple moving average (SMA) of daily volume. You can adjust the lookback period in settings.
Works on any instrument: stocks, futures, forex, crypto. 指標

指標

指標

策略

Dynamic Previous Period Highs and Lows + Sessions + MacrosInstitutional Liquidity & Multi-Timeframe Open Levels
This comprehensive institutional trading tool is designed for day traders who rely on high-probability liquidity levels and key institutional opening prices. It automates the tracking of previous period highs and lows across multiple timeframes while providing precise visualization of New York session opens and critical trading macros.
Key Features
1. Dynamic HTF Liquidity Levels
The indicator automatically plots the High and Low of the previous period for the following timeframes:
15-Minute (15M)
1-Hour (1H)
4-Hour (4H)
Daily (D)
These levels serve as primary targets for liquidity runs (Buy-side/Sell-side liquidity) and are essential for identifying "Previous Day High/Low" (PDH/PDL) setups.
2. Institutional Opening Prices
Opening prices act as magnets and "fair price" anchors. This script tracks the most significant New York opens:
NY Midnight Open: The true start of the institutional day.
8:30 AM Open: Often associated with high-impact news releases and the start of the pre-market volatility.
9:30 AM Open: The equities market open (NYSE), frequently a catalyst for the day's trend or a "Judas Swing."
Note: These lines automatically clean up at 18:00 (6:00 PM) NY time to prepare your chart for the next trading day.
3. Session & Macro Tracking
The indicator includes deep integration for session-based trading:
Sessions & Killzones: Visualizes Asia, London, NY AM, and NY PM sessions with integrated library support for "Kill Zone" detection.
NY Macros: Highlights critical macro windows (02:00-03:00, 10:00-11:00, and 15:00-16:00 NY Time) where algorithmic activity typically spikes.
4. Clean & Intelligent Visuals
Text-Only Labels: To avoid chart clutter, labels are rendered as text-only (transparent backgrounds), color-matched to their respective lines.
Timeframe Filters: Higher-frequency levels (like 15M and 1H) are automatically hidden on higher timeframes to keep your analysis focused and professional.
How to Use
Liquidity Purge: Look for price to sweep the Previous Period High or Low before seeking a reversal.
Premium/Discount: Use the Daily Open and NY Opens to determine if you are buying in a discount (below open) or selling in a premium (above open).
Session Confluence: Look for setups that occur within the highlighted Macro windows or during the start of the NY AM/PM sessions.
Settings
Toggle Levels: Individually show or hide any HTF level or Open price.
Custom Colors: Fully customizable colors for all sessions, macros, and opening lines.
Timezone Logic: The script uses America/New_York timezone for all time-based opens, ensuring accuracy regardless of your local time settings.
指標

指標
指標

指標

指標

指標

指標

Trend Level-Chance 6-13-5 MA10getScore(tf) =>
float price = request.security(syminfo.tickerid, tf, close)
float ma10 = request.security(syminfo.tickerid, tf, ta.sma(close, 10))
= request.security(syminfo.tickerid, tf, ta.macd(close, 6, 13, 5))
int score = 0
// MA10
score += price > ma10 * (1 + bandPct) ? 1 : price < ma10 * (1 - bandPct) ? -1 : 0
// MACD
float diff = macdLine - signalLine
float threshold = ta.ema(math.abs(macdLine), 100) * (bandPct * 100)
score += diff > threshold ? 2 : diff < -threshold ? -2 : 0
// Chuẩn hóa score về -3 → +3
score := math.max(-3, math.min(3, score))
指標

指標

指標

指標

指標

EMA Trend System with ORB, VWAP & Bias Score - by TenAMTraderEMA Trend System with ORB, VWAP & Bias Score
The EMA Trend System with ORB, VWAP & Bias Score is a streamlined intraday trading tool designed to help traders quickly understand trend direction, market bias, and opening range structure.
This indicator combines EMA trend structure, VWAP positioning, Opening Range levels, daily moving averages, a dynamic EMA cloud, and a weighted bias engine into one clean visual system. A compact on-chart table summarizes key market conditions so traders can quickly determine whether the environment favors long trades, short trades, or caution.
The goal is simple: help traders stay aligned with the dominant trend instead of reacting late to price movement.
Core Features:
EMA Trend Structure
The indicator tracks the relationship between the 3, 8, 21, and 200 EMAs to identify trend alignment.
Features include:
• 8 / 21 EMA Cloud for visual trend bias
• EMA stacking logic for bullish or bearish structure
• Optional 3/21 EMA cross signals for momentum shifts
• Optional 3 EMA visibility toggle
This provides a fast visual read on trend strength and structure.
Trend Background Visualization
Optional background coloring helps traders quickly recognize market bias.
Two modes are available:
• Fast Bias Mode – reflects bullish or bearish EMA positioning
• Strict Trend Mode – highlights confirmed trend alignment
This allows traders to quickly see whether market conditions favor bullish momentum, bearish momentum, or neutral structure.
Opening Range System
The Opening Range module helps frame early session price structure.
Levels plotted:
• ORBH – Opening Range High
• ORBM – Opening Range Midpoint
• ORBL – Opening Range Low
Options include:
• Adjustable Opening Range duration
• Optional Opening Range box visualization
• Optional ORB labels placed directly on the levels
• Optional signal filtering based on ORB breakouts
These levels help identify breakout zones and key intraday support/resistance.
Smart Trade Signals
The indicator includes reclaim-style signals designed for trend continuation setups.
Signals occur when price:
• Reclaims the fast EMA
• Aligns with EMA trend structure
• Meets optional Opening Range conditions
Optional Re-Entry signals appear when price pulls back to the 8 EMA while holding the 21 EMA, allowing traders to participate in continuation moves without chasing price.
Bias Score (1–10)
A built-in Bias Score summarizes overall market sentiment using multiple structural factors:
• Position relative to 200 EMA
• Position relative to VWAP
• Position relative to 20-day SMA
• Position relative to 50-day SMA
• EMA structure alignment
• Opening Range behavior
• Current candle direction
Score interpretation:
1–3 → Bearish
4–6 → Neutral
7–10 → Bullish
This provides a quick numerical gauge of overall market conditions.
Trend Summary Table
A compact table displayed on the chart provides an instant overview of market structure.
The table displays:
• Trend Direction
• Trend Strength
• 21 EMA Bias
• 200 EMA Position
• Bias Score
This allows traders to quickly evaluate the market environment without scanning multiple indicators.
Best Use Cases
This indicator works well for:
• Index futures trading (NQ, MNQ, ES)
• Intraday momentum trading
• Opening Range breakout strategies
• EMA trend structure trading
• VWAP-based trading
It can also be applied to stocks and ETFs where trend structure and VWAP behavior are important.
Tip
Many traders focus on long setups when the Bias Score is 7 or higher and short setups when the Bias Score is 3 or lower, while price remains aligned with the EMA cloud.
If you find this indicator helpful, please consider leaving a like.
Disclaimer
This indicator is provided for educational and informational purposes only and does not constitute financial advice. Trading financial markets involves significant risk and may not be suitable for all investors. Indicator signals and historical performance do not guarantee future results. Users are solely responsible for their own trading decisions and risk management. 指標

指標

指標

指標

指標

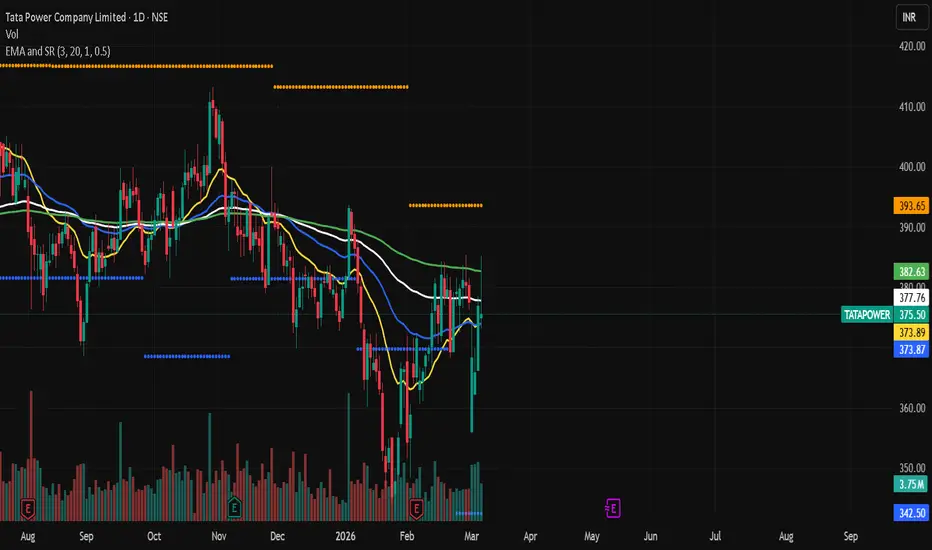
Quadruple EMA with Support and Resistance# EMA Trend + Support & Resistance Strategy
## Overview
A clean, rule-based trading strategy designed for the **Daily timeframe**. It uses four Exponential Moving Averages (EMA 20, 50, 100, 200) as a trend filter combined with dynamic Support & Resistance levels to identify high-probability breakout and breakdown setups.
The logic is intentionally simple — no indicators stacked on indicators, no complex filters. Just price, trend direction, and key levels.
---
## How It Works
### Entry — Long (CE / Buy)
A long entry is triggered when:
- Price closes **above all four EMAs** (20, 50, 100, 200) — confirming strong bullish trend alignment
- Price **breaks above the previous bar's high** — confirming momentum and breakout
### Entry — Short (PE / Sell)
A short entry is triggered when:
- Price closes **below all four EMAs** (20, 50, 100, 200) — confirming strong bearish trend alignment
- Price **breaks below the previous bar's low** — confirming momentum and breakdown
### Exit Logic
- **Stop Loss** — set at the previous bar's low (for longs) or previous bar's high (for shorts)
- **Target** — calculated using the configurable Risk:Reward Ratio (default 3:1)
- **EMA-based dynamic exit** — if price closes below EMA 20 or EMA 50 (for longs), or above EMA 20 or EMA 50 (for shorts), the stop is tightened to force an exit on the next bar, protecting open profit
- **Optional Trailing Stop Loss** — activates after a defined profit % is reached, then trails at a set % distance from the peak
---
## Indicators on Chart
| Line | Color | Meaning |
|------|-------|---------|
| EMA 20 | Yellow | Fast trend / momentum |
| EMA 50 | Blue | Mid-term trend |
| EMA 100 | White | Medium-long trend support |
| EMA 200 | Green | Long-term trend direction |
| Resistance | Orange dots | Swing high levels |
| Support | Blue dots | Swing low levels |
| ▲ Green arrow | Below bar | Long (CE) entry signal |
| ▼ Red arrow | Above bar | Short (PE) entry signal |
---
## Settings
| Input | Default | Description |
|-------|---------|-------------|
| Risk Reward Ratio | 3.0 | Target = Entry + (RR × Risk) |
| Show Support/Resistance | On | Toggle S/R level plots |
| Swing Detection Bars | 20 | Lookback bars for pivot detection |
| One Trade Per Day | On | Limits to one CE and one PE per day |
| Use Trailing Stop Loss | Off | Enable trailing SL after activation |
| Trailing Activation % | 1.0% | Profit % before trailing SL kicks in |
| Trailing Distance % | 0.5% | Distance the trailing SL follows from peak |
---
## Best Used On
- **Timeframe:** Daily (recommended), Weekly
- **Instruments:** Stocks, Indices, ETFs
- Works well on trending instruments where EMA stacking is meaningful
---
## Notes
- This strategy does **not** use candle body filters, volume filters, or session time windows — keeping it universally applicable across timeframes and instruments
- One trade per direction per day is enforced by default to avoid overtrading
- Both CE (long) and PE (short) trades cannot be open simultaneously
---
⚠️ **Disclaimer:** This strategy is for educational and backtesting purposes only. Past performance does not guarantee future results. This is not financial advice. Always do your own research and consult a qualified financial advisor before making any trading decisions. 策略