指標

指標

SHK 3 MA EMA WMA | VWAP | TRIANGLE CROSS━━━━━━━━━━━━━━━━━━━━━━━━━━━━━━━━━━━━━━
SHK 3 MA EMA WMA | VWAP | ▲▼ CROSS
━━━━━━━━━━━━━━━━━━━━━━━━━━━━━━━━━━━━━━
A clean and powerful multi-purpose trend indicator combining
3 fully customisable Moving Averages with crossover signals
and an anchored VWAP — all in one overlay.
━━━━━━━━━━━━━━━━━━━━━━━━━━━━━━━━━━━━━━
MOVING AVERAGES
━━━━━━━━━━━━━━━━━━━━━━━━━━━━━━━━━━━━━━
• 3 independent Moving Averages — MA1, MA2, MA3
• Each MA is individually selectable as EMA / SMA / WMA
• Each MA has its own length input
• Default lengths: MA1 = 9 | MA2 = 21 | MA3 = 50
• Color, opacity, thickness and line style controlled
directly from the chart legend (click the line name)
━━━━━━━━━━━━━━━━━━━━━━━━━━━━━━━━━━━━━━
CROSSOVER SIGNALS
━━━━━━━━━━━━━━━━━━━━━━━━━━━━━━━━━━━━━━
Two sets of cross signals with triangle labels:
▲ MA1 × MA2 — Bullish cross (triangle below bar)
Label shows actual lengths e.g. "9×21"
▼ MA1 × MA2 — Bearish cross (triangle above bar)
Label shows reversed lengths e.g. "21×9"
▲ MA2 × MA3 — Bullish cross (triangle below bar)
Label shows actual lengths e.g. "21×50"
▼ MA2 × MA3 — Bearish cross (triangle above bar)
Label shows reversed lengths e.g. "50×21"
Triangle colors match their respective MA line colors.
━━━━━━━━━━━━━━━━━━━━━━━━━━━━━━━━━━━━━━
VWAP
━━━━━━━━━━━━━━━━━━━━━━━━━━━━━━━━━━━━━━
• Volume Weighted Average Price (VWAP)
• Selectable anchor period:
Session | Week | Month | Quarter | Year
• Toggle on/off from settings
• Color, opacity, thickness and line style
controlled from chart legend
━━━━━━━━━━━━━━━━━━━━━━━━━━━━━━━━━━━━━━
ALERTS
━━━━━━━━━━━━━━━━━━━━━━━━━━━━━━━━━━━━━━
4 built-in alert conditions:
• MA1 Crossed Above MA2 ▲ (Bullish)
• MA1 Crossed Below MA2 ▼ (Bearish)
• MA2 Crossed Above MA3 ▲ (Bullish)
• MA2 Crossed Below MA3 ▼ (Bearish)
━━━━━━━━━━━━━━━━━━━━━━━━━━━━━━━━━━━━━━
HOW TO USE
━━━━━━━━━━━━━━━━━━━━━━━━━━━━━━━━━━━━━━
1. Add indicator to chart
2. Set MA types and lengths in Settings
3. Click any line name in chart legend to
adjust color, opacity, thickness and style
4. Use VWAP as dynamic support/resistance
5. Set alerts from the Alerts menu
━━━━━━━━━━━━━━━━━━━━━━━━━━━━━━━━━━━━━━
⚠️ DISCLAIMER
━━━━━━━━━━━━━━━━━━━━━━━━━━━━━━━━━━━━━━
This indicator is for educational and
informational purposes only. It does NOT
constitute financial advice, investment
advice, or a recommendation to buy or sell
any financial instrument.
Past performance of any indicator or strategy
does not guarantee future results. Trading
involves significant risk of loss and is not
suitable for all investors. Always do your own
research and consult a qualified financial
advisor before making any trading decisions.
The author accepts no responsibility for any
losses incurred from the use of this indicator.
━━━━━━━━━━━━━━━━━━━━━━━━━━━━━━━━━━━━━━
© SHK — All rights reserved
━━━━━━━━━━━━━━━━━━━━━━━━━━━━━━━━━━━━━━ 指標

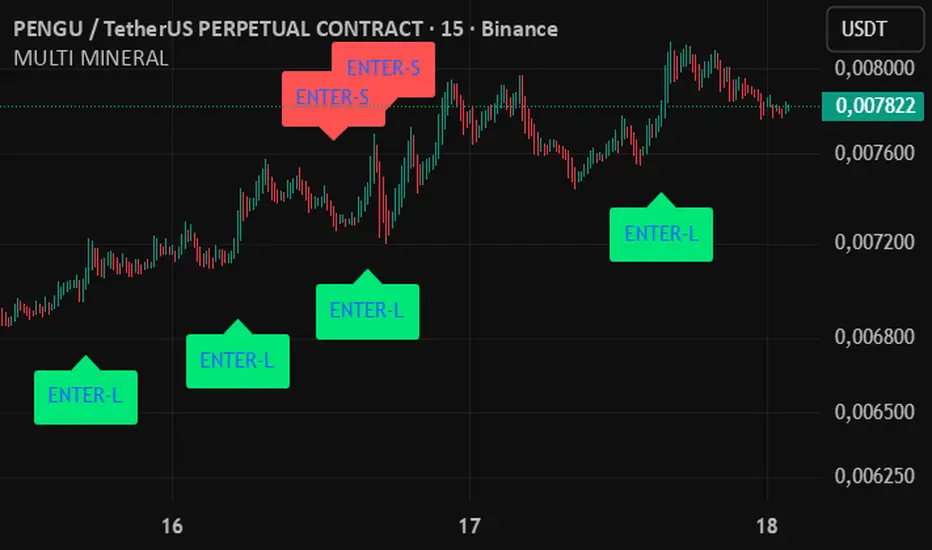
MULTIMINERALMULTIMINERAL: Advanced Signal Engine & Dynamic State Tracker
Description:
Welcome to MULTIMINERAL. This indicator is built upon the exact same robust algorithmic foundation as its predecessor, but it introduces highly advanced trade management and state-tracking mechanics. If you want to explore the original core system, you can find MULTIVITAMIN here:
tr.tradingview.com
The Core Engine: Advanced Confluence & Price Action
At its heart, MULTIMINERAL analyzes market structure through a highly sensitive technical confluence, combining traditional momentum indicators with pure price action and volume dynamics. The engine relies on:
Price Action & Smart Money Concepts: Actively detecting high-probability candlestick formations like Engulfing patterns, while identifying critical FVG (Fair Value Gaps) to pinpoint liquidity zones and explosive entry points.
Volume Analysis: Validating the true strength and institutional backing behind every price movement to filter out fake breakouts.
Hull Moving Average (HMA): Utilized for ultra-fast, lag-free trend identification.
EMA & EMA Slope: Exponential Moving Averages combined with precise slope (trajectory) analysis to catch the exact moment a trend accelerates or loses momentum.
ADX, RSI & Momentum: A layered combination to gauge absolute trend strength, overbought/oversold extremes, and price velocity.
The Key Difference: Why MULTIMINERAL?
While both indicators share the same DNA, the critical difference lies in State Management, Dynamic Exits, and how the system handles Repeating Signals.
Exit on Reverse Signal: Standard algorithmic systems often get stuck waiting for fixed take-profit or stop-loss levels. MULTIMINERAL is strictly dynamic. If the underlying market structure flips and the indicator detects an opposite signal, it immediately invalidates the current bias and exits.
The "Virtual Treasury" (1.9% & 2.1% Thresholds): MULTIMINERAL constantly tracks a virtual position. If the price movement reaches critical breaking points—specifically the 1.9% or 2.1% PnL thresholds—the system instantly realizes the previous cycle is functionally over. It completely resets its internal state (bot status returns to zero).
Catching Repeating Signals: Because of this immediate state shift, MULTIMINERAL never misses fresh opportunities. While standard systems are "locked" into an old, ongoing trade, MULTIMINERAL scans the market with a clean slate. It successfully catches overlapping or "repeating signals," firing a brand new entry precisely when the market pivots again.
The 32-Candle Verification Window: To ensure these state shifts and repeating signals are accurate—and to filter out market noise—the algorithm cross-references the new setup against a strict 32-candle lookback window. The volume, EMA slopes, momentum, and price action must validate the trend shift within these last 32 bars before the overriding signal is printed.
MULTIMINERAL is designed for traders who need a hyper-responsive, adaptive system that recalculates market reality instantly, dynamically exits on reverse conditions, and capitalizes on every structural pivot. 指標

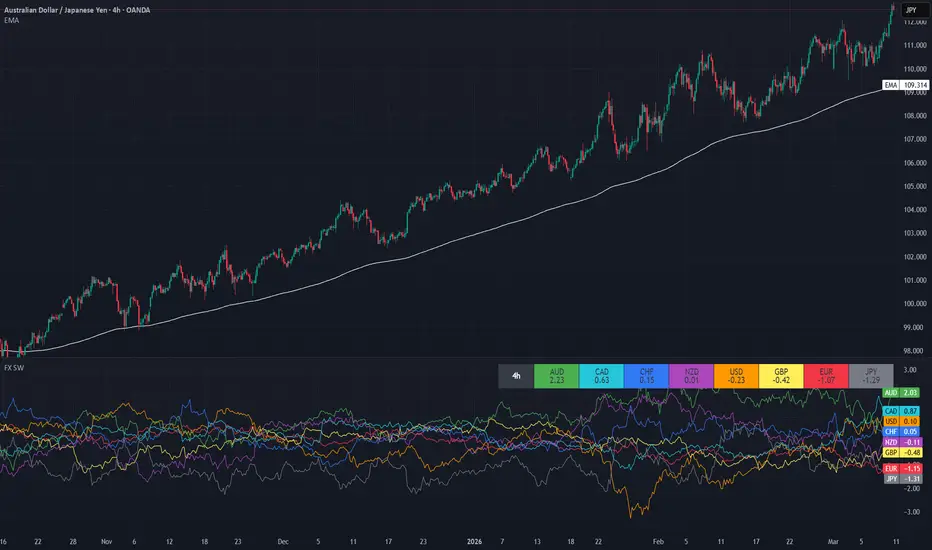
Forex Strong Weak Analysis (FX SW)
Overview
This indicator measures and ranks the relative strength of the 8 major forex currencies (EUR, USD, GBP, AUD, CAD, CHF, NZD, and JPY) by analysing price deviations from a moving average on each of the 28 currency pairings.
How It Works
The indicator measures momentum by calculating each pair’s percentage deviation from an exponential moving average (EMA). This value is then given to both the base and quote currencies as shown:
Base currency gains strength (+) when price is above its EMA.
Quote currency loses strength (-) when price is above its EMA.
Base currency loses strength (-) when price is below its EMA.
Quote currency gains strength (+) when price is below its EMA.
Each currency’s final strength value is derived by averaging its performance across all its pairs, ensuring a balanced and normalised result.
Key Features
Choose the broker for the 28 currency pairs.
Change the EMA length (default: 200).
Change the EMA timeframe (default: 4H).
Strength lines and table:
- Strength lines are real-time for each currency.
- Ranking table displays strongest to weakest currencies, based on the last candle that closed.
Changeable colours.
Open Source.
How to Use
Great if you use an Exponential Moving Average as part of a trend trading system.
Identify the strongest and weakest currencies with the indicator.
And look to trade pairs that combine them.
Typical workflow example:
Check the ranking table.
Identify strongest currency (e.g., AUD)
Identify weakest currency (e.g., JPY)
Trade: AUDJPY
I recommend also enabling indicator name and value labels on the price scale, if you like that.
Important Notes
This indicator measures relative strength, not absolute direction.
Best used in trending or expanding market conditions.
Read the information buttons in the indicator settings.
Disclaimer
This tool is intended for analysis and educational purposes only. It does not provide financial advice and should be used in conjunction with other forms of analysis and risk management.
指標

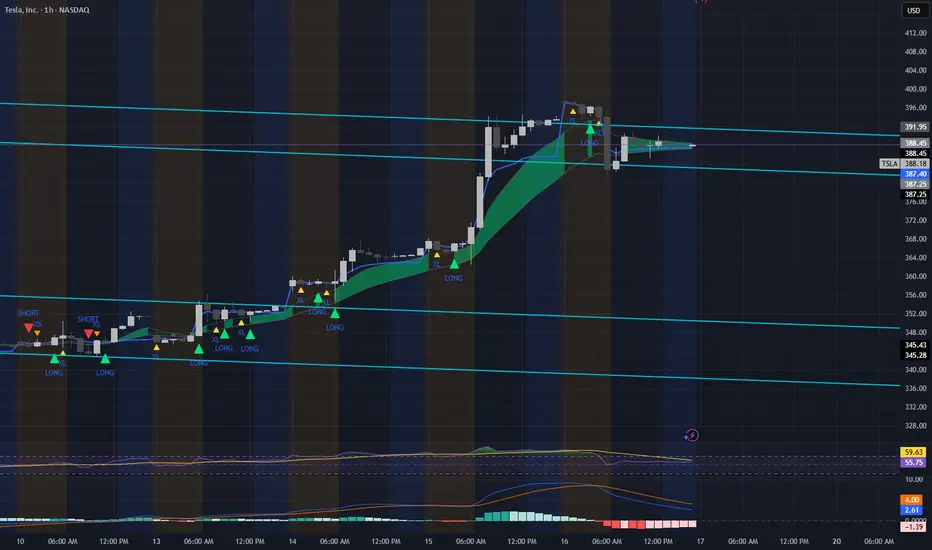
Jan Buy, Hold, Add c TP/baghold-doi warningThis indicator is built on a trend-following framework combined with pullback entry and momentum confirmation. Its purpose is to help traders enter early in a developing uptrend and add to positions systematically when price pulls back within the main trend.
The strategy is structured around two buying phases.
Buy1 is the initial entry signal at the early stage of a trend. It is designed to capture the beginning of a bullish move when price structure starts turning positive and momentum confirms the setup. The goal of Buy1 is to establish a position early, before the trend fully expands.
Buy2 is the add-on entry during a pullback. It looks for a new swing low that remains higher than the previous swing low, while MACD also shows improving momentum. This signal is intended for adding to an existing position during a healthy retracement, with the Stop Loss anchored to the EMA100 in order to keep risk aligned with the primary trend.
Another key component is the “doi” warning signal. “Doi” is Thai stock-trader slang referring to buying near the top and getting stuck at the peak. In this indicator, the doi signal acts as a warning not to add more or open new positions at that stage, because the probability of ending up trapped near the high is increasing. In English, the closest concept would be baghold or bagholding risk.
For profit management, the script is not designed around exiting the full position at a single target. Instead, it follows a scale-out approach, allowing profits to be taken gradually as price extends and momentum evolves. This is intended to help traders stay with strong trends longer while reducing the risk of exiting too early.
This indicator works best on stocks or other assets that tend to move in sustained, directional trends. It is especially suitable for instruments that can trend for extended periods, because the logic is based on entering early in a trend and adding on constructive pullbacks, rather than trading short-term reversals in sideways conditions.
อินดิเคเตอร์นี้ถูกออกแบบบนแนวคิดของ trend following ร่วมกับ pullback entry และ momentum confirmation โดยมีเป้าหมายเพื่อช่วยให้นักลงทุนเริ่มเข้าซื้อในช่วงต้นของแนวโน้มขาขึ้น และสามารถวางแผนซื้อเพิ่มอย่างมีระบบเมื่อราคาเกิดการย่อในเทรนด์หลัก
แนวคิดหลักของระบบคือแบ่งการเข้าซื้อออกเป็น 2 จังหวะ
Buy1 คือสัญญาณซื้อช่วงต้นเทรนด์ ใช้เพื่อจับจุดเริ่มต้นของแนวโน้มขาขึ้น เมื่อโครงสร้างราคาเริ่มเปลี่ยนเป็นบวกและ momentum สนับสนุน เป้าหมายของ Buy1 คือการเริ่มต้นถือ position ตั้งแต่ระยะเริ่มต้นของเทรนด์ ก่อนที่ราคาเข้าสู่ช่วงเร่งตัว
Buy2 คือสัญญาณซื้อเพิ่มระหว่างทาง เมื่อราคาเกิด pullback แต่ยังคงรักษาโครงสร้างขาขึ้นไว้ โดยระบบจะมองหาจุด swing low ใหม่ที่ยกสูงกว่าสวิงโลว์ก่อนหน้า พร้อมกับ MACD ที่แสดงแรงส่งดีขึ้น สัญญาณนี้ใช้เพื่อเพิ่ม position ในช่วงย่อ โดยกำหนด Stop Loss อ้างอิงจาก EMA100 เพื่อควบคุมความเสี่ยงให้อยู่ในกรอบของเทรนด์หลัก
อีกองค์ประกอบสำคัญคือสัญญาณ “doi” ซึ่งเป็นคำแสลงในหมู่นักเล่นหุ้นไทย หมายถึงภาวะที่ซื้อบนยอดหรือไปติดอยู่บนภูเขา ในบริบทของอินดิเคเตอร์นี้ “doi” ใช้เป็นสัญญาณเตือนว่าไม่ควรเปิด order เพิ่ม หรือไม่ควรไล่ซื้อเพิ่มในจังหวะนั้น เพราะมีความเสี่ยงที่จะกลายเป็นการถือของบนยอด หากเทียบในภาษาอังกฤษ แนวคิดนี้ใกล้เคียงกับคำว่า baghold หรือ bagholding risk
ในด้านการบริหารกำไร อินดิเคเตอร์นี้ไม่ได้มอง Take Profit เป็นจุดขายออกทั้งหมดในครั้งเดียว แต่เน้นแนวคิดการทยอยแบ่งขายทำกำไร หรือ scale out ตามสภาพของราคาและ momentum เพื่อให้สามารถรักษาผลกำไรจากเทรนด์ที่กำลังวิ่ง และลดความเสี่ยงจากการขายหมดเร็วเกินไป
ระบบนี้เหมาะกับหุ้นหรือสินทรัพย์ที่มีลักษณะเคลื่อนไหวเป็นแนวโน้มชัดเจนและสามารถวิ่งต่อเนื่องได้ยาว เช่น หุ้นที่อยู่ในรอบขาขึ้นเด่น หรือสินทรัพย์ที่มี momentum ต่อเนื่อง เพราะแนวคิดของระบบอาศัยการ “เริ่มต้นถือเมื่อเทรนด์เริ่มมา” และ “เพิ่มเมื่อย่อในเทรนด์” มากกว่าการเทรดสวนทางหรือเก็งกำไรระยะสั้นในตลาด sideway
指標

指標

指標
策略

指標

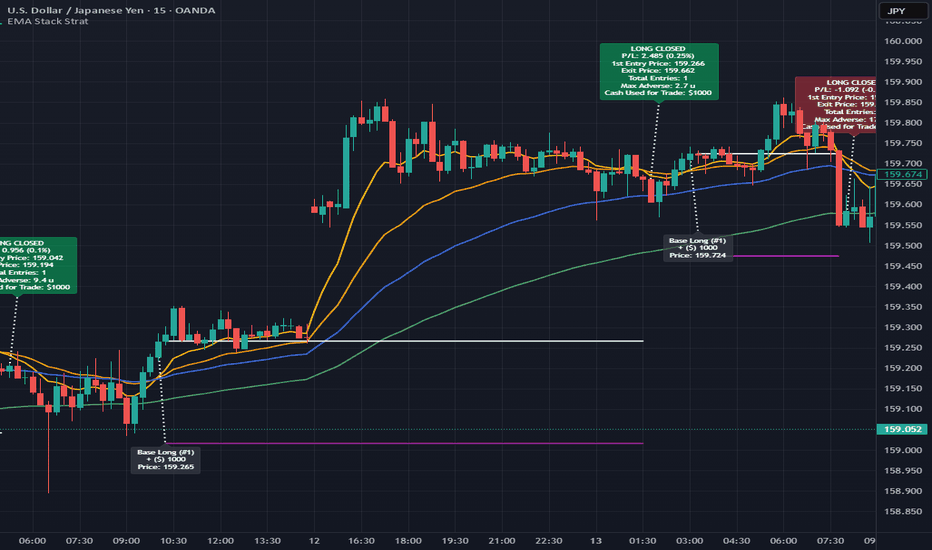
EMA Stack Strategy (DCA or Single Entry, HTF Logic)This strategy implements a multi-moving-average (MA) stacking system combined with flexible execution modes, allowing traders to test both trend-following entries and position management techniques within a single framework.
Core concept
The strategy uses up to four configurable moving averages to define directional bias. A valid trend is identified when the averages are properly stacked (e.g., faster MAs above slower MAs for long trades). Entries can optionally require multiple confirmed closes in a valid stack, which helps reduce noise and avoid premature signals.
Higher timeframe logic and non-repainting behavior
The script supports running MA calculations on a higher timeframe while executing on a lower chart timeframe. Signals are only updated on confirmed higher timeframe closes using request.security() with lookahead disabled, which prevents repainting and ensures that historical results reflect confirmed data.
Dual trading modes
Two execution modes are available:
* DCA / Grid mode: builds a position through multiple entries as price moves against the initial trade. Spacing between entries can be based on fixed units, percentage, or ATR, and can expand progressively using a scaling factor.
* Single Entry mode: places one position per signal and manages it using a selectable exit system.
DCA system design
The DCA module is not a simple averaging tool. It includes:
* Configurable spacing using Units, Percent, or ATR
* Optional geometric spacing expansion (step scaling)
* Position sizing growth (volume scaling) or manual ladder sizing
* Maximum total capital cap to limit exposure
* Choice between anchoring to first entry price or average position price
This structure allows users to test different grid-style risk distributions rather than relying on fixed averaging.
Exit logic
Exit behavior differs by mode:
* DCA mode:
* Take profit is calculated from the average entry (breakeven) plus an offset
* Optional trailing stop activates after price moves in favor
* Optional “after last DCA” exit logic targets a move from the final entry instead of the average price
* Optional MA-based kill switch to close positions when trend structure breaks
* Single Entry mode:
* Multiple exit types including MA cross, ATR-based bracket, risk-reward bracket, percent-based bracket, and time stop
* Optional break-even adjustment
* Optional independent trailing stop
Risk and position management
The strategy includes controls to:
* Limit total capital deployed in DCA mode
* Adjust position sizing per entry
* Configure stop distances using ATR, percent, or structure
* Prevent new trades or DCA adds during specific time windows
These tools are intended to help simulate more realistic position management conditions rather than fixed, static strategies.
Visualization and usability
The script provides:
* Clear MA overlays for trend structure
* Optional plotting of average entry, take profit, and next DCA level
* Trade summary labels including P/L, number of entries, and drawdown in units
* Optional status table showing real-time strategy state
Notes on backtesting and usage
* Results depend heavily on parameter selection, market conditions, and timeframe
* DCA/grid strategies can increase exposure during adverse price movement and should be tested carefully
* Default settings use zero commission and slippage; users should adjust these to better reflect real trading conditions
* Past performance does not guarantee future results
This script is intended as a configurable framework for testing MA-based trend entries combined with different position management techniques, rather than a fixed or optimized trading system. 策略
指標

EMA Trend Vol Desviacion TDCEste indicador combina tres capas de análisis en una sola herramienta visual: tendencia mediante EMA dinámica, confirmación por volumen y bandas de desviación estándar como canal de volatilidad. Está diseñado para operar en temporalidades cortas (1m, 5m, 15m), especialmente en futuros como el Nasdaq (NQ), aunque funciona en cualquier activo.
La idea central es simple: un cruce de la EMA solo es relevante si viene respaldado por volumen significativo. El indicador filtra automáticamente los cruces débiles y solo señaliza aquellos donde la vela cruza la EMA con su cuerpo completo (apertura de un lado, cierre del otro) y el volumen supera un umbral dinámico basado en la media de volumen reciente.
¿Qué muestra en el gráfico?
EMA Dinámica con color de tendencia
La media móvil exponencial cambia de color según la posición del precio: verde cuando el precio está por encima (tendencia alcista) y roja cuando está por debajo (tendencia bajista). El grosor facilita identificar la tendencia dominante de un vistazo.
Bandas de Desviación Estándar
Dos bandas envuelven la EMA a una distancia configurable medida en desviaciones estándar. Funcionan como un canal de volatilidad: cuando el precio toca o supera una banda, está en una zona de extensión. El área entre las bandas se rellena con color suave para delimitar visualmente la zona de equilibrio.
Etiquetas de Volumen en Cruces Válidos
Cuando una vela cruza la EMA con volumen fuerte, aparece una etiqueta verde (cruce alcista) o roja (cruce bajista) mostrando el volumen exacto de esa vela. Las etiquetas solo aparecen en cruces confirmados, no en cada toque de la media.
Filtro de Repetición
El indicador no repite señales consecutivas en la misma dirección. Si ya marcó un cruce alcista, no marcará otro alcista hasta que ocurra un cruce bajista (o un cruce sin volumen resetee el estado). Esto evita la acumulación de señales redundantes.
Panel de Presión de Volumen
Un cuadro en pantalla muestra el volumen acumulado neto de los últimos N días (configurable). Suma el volumen de los cruces alcistas y resta el de los bajistas. Si el número es positivo y verde, la presión compradora domina. Si es negativo y rojo, la presión vendedora domina. Es una lectura rápida del sesgo del mercado.
Parámetros Configurables
Periodo de la EMA (default: 50) — Longitud de la media móvil exponencial.
Fuente de la EMA (default: close) — Dato de precio para calcular la EMA.
Sensibilidad de Volumen (default: 1.1) — Multiplicador sobre la media de volumen. Un valor de 1.1 significa que la vela debe tener al menos 110% del volumen promedio para activar la señal. Subir este valor hace el filtro más estricto.
Media de Volumen (default: 20) — Periodo para calcular el volumen promedio de referencia.
Multiplicador Desviación (default: 2.0) — Cuántas desviaciones estándar se alejan las bandas de la EMA.
Periodo Desviación (default: 50) — Periodo para calcular la desviación estándar.
Días atrás para el Acumulado (default: 2) — Ventana de tiempo para el cálculo de presión de volumen neta.
Posición del Cuadro — Esquina donde se muestra el panel de presión.
Cómo Usarlo
Identificar tendencia: Si la EMA es verde y el precio está por encima, buscar operaciones largas. Si es roja y el precio está por debajo, buscar cortos.
Esperar la señal: No entrar en cualquier cruce. Esperar a que aparezca la etiqueta de volumen, que confirma que el cruce tiene participación real del mercado.
Leer las bandas: Si el precio cruza la EMA pero ya está cerca de la banda opuesta, el recorrido potencial es limitado. Las mejores entradas ocurren cuando el cruce sucede cerca de la EMA y hay espacio hasta la banda en la dirección del trade.
Consultar la presión: Antes de operar, mirar el panel de presión. Si vas a entrar largo pero la presión acumulada es fuertemente negativa, actúa con más cautela o espera confirmación adicional.
Para Qué Activos y Temporalidades
Optimizado para futuros del Nasdaq (NQ) en 15 minutos, pero adaptable a cualquier activo ajustando la sensibilidad de volumen según la liquidez del instrumento. Funciona en temporalidades de 1m a 1H. Para temporalidades mayores (4H, diario), considerar aumentar el periodo de la EMA.
Aviso
Este indicador es una herramienta de análisis técnico, no una señal automática de compra o venta. Siempre complementar con gestión de riesgo adecuada y análisis de contexto de mercado. 指標

指標

指標

EMA 9/21 GoldenX Pro-TSL█ OVERVIEW
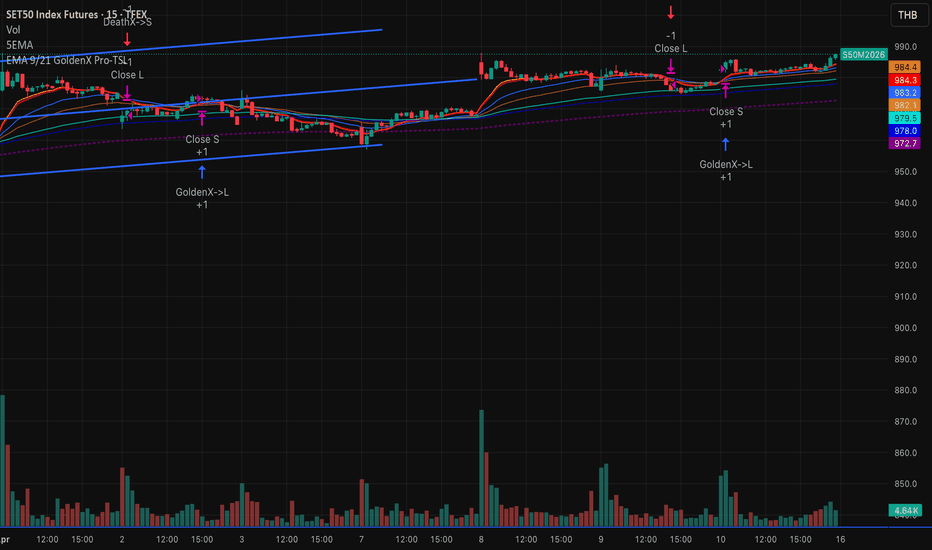
EMA GoldenX Pro-TS is a trend-following strategy built around the classic EMA crossover (Golden Cross / Death Cross), enhanced with multi-layer confirmation filters and dynamic risk management. It is designed for traders who want clean, rule-based entries while avoiding choppy, low-conviction signals.
█ HOW IT WORKS
ENTRY LOGIC
• A Long entry triggers when the Fast EMA crosses above the Slow EMA (Golden Cross), confirmed by rising volume OR rising price action, AND a trending market condition (ADX filter).
• A Short entry triggers when the Fast EMA crosses below the Slow EMA (Death Cross), confirmed by rising volume OR falling price action, AND a trending market condition.
POSITION FLIPPING
• When already in a position and the opposite EMA cross occurs, the strategy can instantly close and reverse (flip). The "Flip on EMA cross only" option lets you bypass the volume/ADX filters on reversal signals — useful for fast-moving markets where waiting for full confirmation may cause late entries.
STOP-LOSS MANAGEMENT
• A dynamic ATR-based trailing stop is calculated each bar.
• A hard percentage-based maximum stop loss acts as a safety net.
• The tighter of the two is always used, providing adaptive risk control that respects both volatility and absolute drawdown limits.
█ FEATURES
• Dual EMA Crossover — Configurable Fast (default 9) and Slow (default 21) EMA periods.
• ADX Trend Filter — Filters out entries during range-bound / low-momentum conditions (ADX threshold + DI spread).
• Volume Confirmation — Requires volume above its 5-bar SMA for fresh entries.
• Price Momentum Check — Validates price direction relative to a 5-bar SMA for additional confluence.
• ATR Trailing Stop — Volatility-adjusted stop that adapts to current market conditions.
• Max Stop Loss % — Hard cap on per-trade risk as a percentage of entry price.
• Trade Direction Control — Choose Long only, Short only, or Both.
• Instant Position Flip — Optionally reverses on EMA cross without waiting for all filters to align.
• Alert Conditions — Built-in alerts for Golden Cross (Long) and Death Cross (Short) signals.
█ SETTINGS
• Fast EMA (default: 9) — Period for the fast EMA line.
• Slow EMA (default: 21) — Period for the slow EMA line.
• Trade Direction (default: Both) — Restrict to Long, Short, or trade Both sides.
• ADX Length (default: 14) — Lookback period for the ADX/DMI calculation.
• ADX Threshold (default: 20) — Minimum ADX value to qualify as a trending market.
• ATR Length (default: 14) — Lookback period for the ATR calculation.
• ATR Multiplier (default: 2.0) — Distance of the ATR trailing stop from the current close.
• Max Stop Loss % (default: 1.0%) — Maximum allowable stop distance as a % of entry price.
• Flip on EMA Cross Only (default: true) — When enabled, position reversals only require the EMA cross, bypassing volume/ADX filters for faster flips.
█ VISUAL OUTPUTS
• Orange line — Fast EMA
• Blue line — Slow EMA
• Red line — Active trailing stop level (visible only while in a position)
█ USAGE NOTES
• Originally designed and tested on TFEX SET50 Index Futures but applicable to any liquid instrument.
• Best suited for trending markets on intraday to swing timeframes.
• Adjust EMA periods and ATR multiplier to match the volatility profile of your instrument.
• Backtest thoroughly on your target market before live deployment.
█ DISCLAIMER
This strategy is provided for educational and research purposes only. Past performance does not guarantee future results. Always manage your risk and trade responsibly. 策略
Pro Volatilite-v61. Hidden Trend Algorithm (Background)
The heart of the code actually beats with a SuperTrend logic. However, it differs from ready-made indicators on the market in two major ways:
Manual Calculation: Instead of the ta.supertrend function, the bands are calculated manually using ATR (Average True Range). This preserves the originality of the code.
ALMA Smoothing: Classic trend lines create sharp, angular "ladder" steps in price changes. Here we used ALMA (Arnaud Legoux Moving Average). ALMA is one of the smoothest averages on the market and makes the trendline silky smooth. This prevents an outsider from realizing it's a SuperTrend.
2. Triple Dynamic Average Set
Three different moving averages run simultaneously on the chart. These are usually set to 20, 50, and 200 periods:
Flexibility: You can change these numbers as you wish from the settings menu (e.g., 9, 21, 100).
Mode Selection: You can change the type of all three lines (SMA, EMA, or VWMA) with a single setting.
Visual Hierarchy: The lines have different thicknesses. The longest-term (200) line is drawn thickest to highlight the main support/resistance level.
3. Fully Customizable Interface
The most user-friendly part of the code is the control panel added to TradingView's "Settings" (gear) menu:
Color Control: You can choose the color tones you want for uptrends and downtrends.
Opacity: You can adjust how prominent the fill between the price and the trend line will be.
On/Off: If you think the screen is too cluttered, you can hide any of the 20-50-200 lines with a single click.
How it Works? (Strategic Use)
Trend Direction: If the main line, which is thick and sloping, is Turquoise (or your chosen color), the market is trending upwards; if it is Pink, it is trending downwards.
Signal Points: Small circles appearing just below or above the candles when the trend reverses indicate the start or end of a trend.
Support and Resistance: The 20, 50, and 200 lines show where the price will rest or rebound within the trend. For example, if the price touches the 50-period moving average (orange line) while above the main trend and receives a reaction, this can be considered a strong buying opportunity. 指標

指標

指標

DDDDD: Liquidity Trap ReversalDDDDD: Liquidity Trap Reversal
This indicator is designed to detect potential reversal zones that form after an apparent liquidity sweep at local extremes.
The core idea is not to chase breakout candles blindly, but to identify situations where price extends into prior highs or lows, attracts participation, and then begins to show signs of exhaustion.
Instead of treating every breakout as continuation, this script looks for a specific reversal environment built from trend context, range expansion, abnormal volume, and momentum slowdown.
Core concept
Markets often move into obvious swing highs or swing lows to trigger stops, breakout entries, or forced positioning.
In some cases, that expansion is not the beginning of a clean trend leg, but the late phase of a move where liquidity is being taken before momentum weakens.
This script attempts to highlight those areas by combining:
a higher-level directional structure,
an extreme test versus recent price range,
a relative volume expansion filter,
a trend-strength condition,
and a momentum-fading condition.
The goal is to mark bars where the move into the extreme may be overextended and vulnerable to reversal.
Logic overview
The script evaluates five main components:
1) Macro directional bias
A Supertrend-derived direction is used as the main structural filter. This acts as the broader directional architecture around the trap event.
2) Extreme sweep detection
Price must reach beyond a recent local extreme:
for bearish trap logic, price pushes into the recent high range,
for bullish trap logic, price sweeps into the recent low range.
The lookback window for this sweep is controlled by the Extreme Lookback input.
3) Relative volume expansion
The script compares current volume against a moving average of volume and flags bars where volume expands beyond a user-defined multiplier.
This is used as a proxy for liquidation, stop-running, or abnormal participation.
4) Trend-strength filter
ADX must remain above a minimum threshold.
This helps avoid treating every small poke above or below a range as meaningful. The script is looking for sweeps that happen in a market with enough directional energy behind the move.
5) Momentum fade
MACD histogram behavior is used to detect whether momentum is no longer accelerating with the same strength.
This does not mean momentum has fully reversed already. It simply aims to capture early signs that the impulse may be losing efficiency.
Signal interpretation
A signal appears when the script finds a combination of:
directional structure,
sweep of a recent extreme,
elevated relative volume,
strong enough ADX,
and fading momentum.
A Bull Trap label marks a downside sweep that may be exhausting and becoming vulnerable to a reversal upward.
A Bear Trap label marks an upside sweep that may be exhausting and becoming vulnerable to a reversal downward.
These labels should be interpreted as context markers, not automatic trade commands.
Timeframe and architecture
The script supports a timeframe override, which allows the calculations to be performed on a selected timeframe instead of the chart timeframe.
This can be useful when the user wants a more stable structural read while viewing a lower timeframe chart.
The Macro EMA is included as an optional visual reference only.
It is not the trigger by itself, but can help users read whether the signal is appearing in a stretched or conflicting area relative to the chosen trend framework.
How to use
This indicator is generally more useful when treated as a reversal context tool rather than a standalone entry system.
Possible ways to use it:
identify sweep-and-fade zones after price attacks obvious highs or lows,
avoid late breakout chasing when a trap condition appears,
combine with market structure confirmation on a lower timeframe,
wait for reclaim / rejection / follow-through before acting,
use it as a filter alongside your own execution model.
Many users may find it more effective to wait for additional confirmation such as:
rejection wicks,
structure shift,
reclaim of prior level,
momentum turn on execution timeframe,
or a clear invalidation level.
Inputs
Macro EMA Length
Defines the EMA length for the optional macro trend reference line.
Supertrend Factor / Period
Controls the structural direction component.
Timeframe Override
Lets the user run calculations on a different timeframe than the current chart.
Extreme Lookback
Defines how far back the script looks to determine recent highs and lows.
Liquidation Vol Threshold
Sets the relative volume multiplier required to classify a bar as abnormal participation.
Min ADX
Minimum trend-strength threshold required before a trap can qualify.
Notes and limitations
This indicator does not predict every reversal, and it is not intended to label all stop-hunts perfectly.
Volume behavior, momentum behavior, and extreme sweeps can look different across markets and symbols.
Signals may behave differently depending on:
asset class,
session structure,
exchange volume quality,
and chosen timeframe.
For that reason, this script is best used as a decision-support tool within a broader trading framework, not as a guaranteed standalone system.
Practical reminder
A trap label does not automatically mean price must reverse immediately.
In strong trends, markets can continue to expand even after an apparent sweep.
Users should always define their own confirmation logic, invalidation rules, and risk management process. 指標

指標

指標

指標