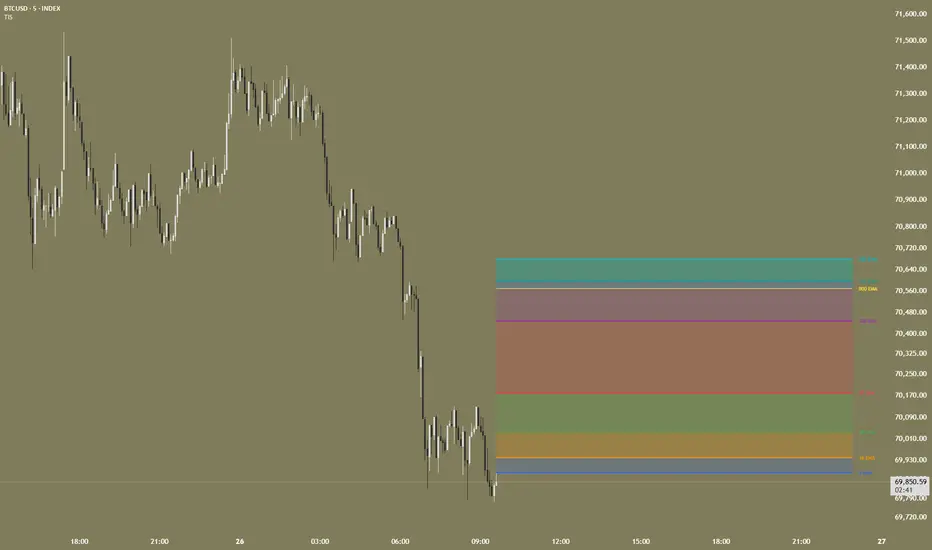
指標

指標

指標

指標

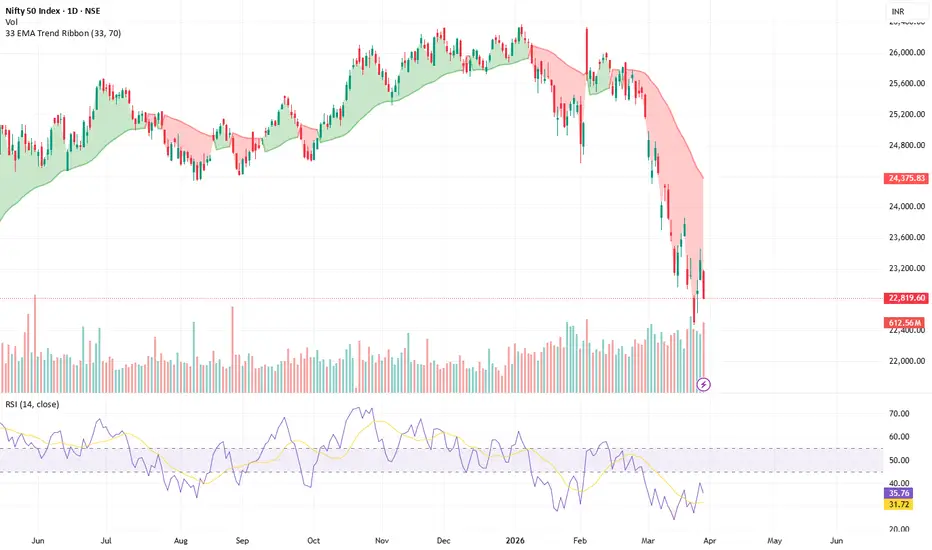
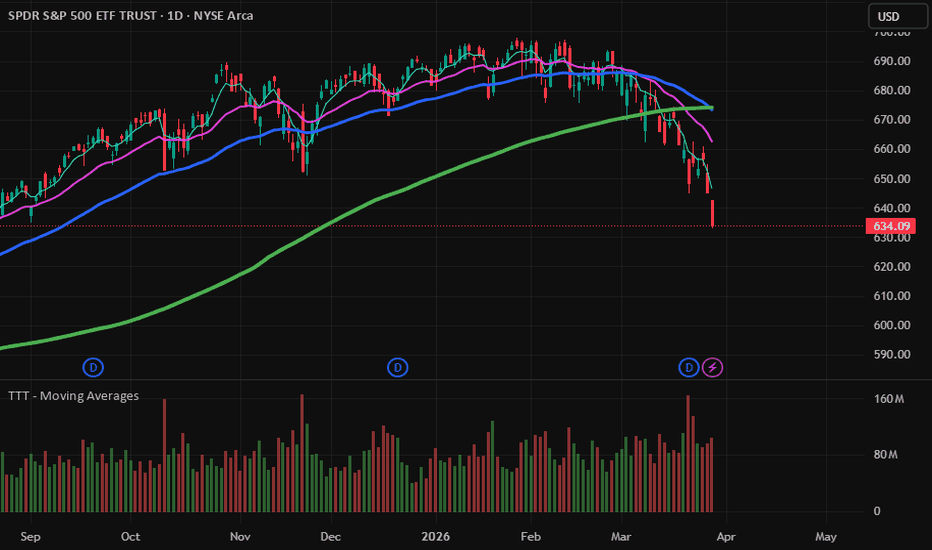
TTT - Trend Identification Moving AveragesWhat This Indicator Does
This indicator is designed to help traders identify and stay aligned with the dominant market trend by combining multiple moving averages with volume analysis. It provides a structured framework to evaluate trend direction, momentum, and participation—without relying on news, fundamentals, or opinions.
The Philosophy Behind It
Markets move in trends—and those trends tend to persist far longer than most investors expect. The biggest mistake traders make is trying to predict reversals instead of recognizing and following the current trend.
This tool is built on a simple principle: Trade with the trend, not against it.
As outlined in Technical Trading Mastery, price action reflects all known information, often reversing well before economic data or news confirms the move . By focusing on price and trend structure, traders can position themselves on the right side of the market rather than reacting emotionally.
How It Works
1. Multi-Timeframe Trend Structure
This indicator uses a combination of short-, intermediate-, and long-term moving averages:
5 EMA → Short-term momentum
20 EMA → Near-term trend direction
50 EMA → Intermediate trend
150 SMA → Long-term market direction
These averages act as dynamic support and resistance levels while also defining trend alignment .
2. Trend Confirmation Logic
The relationship between moving averages helps define market conditions:
- When shorter-term averages are above longer-term averages → Uptrend
- When shorter-term averages fall below longer-term averages → Downtrend
- When averages compress or move sideways → Consolidation / indecision
A key concept:
- When the 50 EMA is above the 150 SMA, the market is considered in a healthy uptrend
- When the 50 EMA falls below the 150 SMA, it signals a potential shift to a bearish environment
This provides a clear, rules-based way to stay aligned with the dominant trend.
3. Entry & Pullback Context
Trends do not move in straight lines—they move in waves. Price will naturally pull back toward moving averages during trends.
These areas can act as:
- Support in uptrends
- Resistance in downtrends
This allows traders to evaluate whether price is:
- Extending (higher risk)
- Pulling back (potential opportunity)
- Breaking trend (potential warning)
4. Volume as Participation Insight
Volume is displayed to provide context behind price movement.
- Rising price with increasing volume → stronger participation
- Rising price with declining volume → weaker conviction
- Sharp volume spikes → potential emotional or institutional activity
Markets are driven by waves of capital flow and crowd psychology, not just price alone . Volume helps reveal when those waves are gaining or losing strength.
Why This Matters
Most traders struggle not because they lack indicators—but because they lack structure and discipline.
This indicator simplifies decision-making by focusing on three key elements:
- Trend direction (Are you aligned with the market?)
- Price location (Are you chasing or buying weakness?)
- Participation (Is there real conviction behind the move?)
Instead of reacting to headlines or emotions, this framework encourages a rules-based approach to understanding market behavior.
How To Use It
- Focus on trading in the direction of the dominant trend
- Use moving averages as a guide for trend alignment and structure
- Observe how price reacts near key averages for potential continuation or warning signals
- Use volume to confirm whether moves are supported by participation
Final Perspective
This tool is not about predicting tops or bottoms.
It is about recognizing trends, understanding market structure, and staying positioned with the flow of capital.
Because in the end, the market rewards those who follow it—not those who fight it. 指標
指標
指標
指標

指標

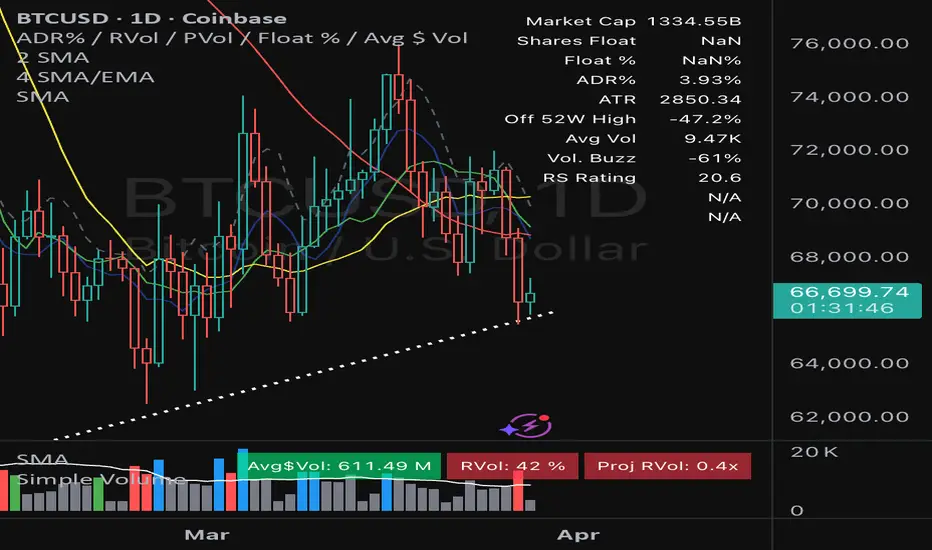
AK MACD BB EMA RSI Scalper Gold ProOverview
The AK MACD BB + EMA/RSI Scalper is a high-precision momentum oscillator designed primarily for Gold (XAUUSD) and high-volatility assets. This indicator reimagines the traditional MACD by wrapping it within Bollinger Bands, allowing traders to identify momentum "breakouts" and "exhaustion" points in real-time.
By integrating a multi-layer trend filter (EMA 200) and a momentum oscillator (RSI), this tool is built to capture "Power Scalps" while avoiding the dangerous "chop" of sideways markets.
The Core Strategy (The Triple-Filter Logic)
To ensure high-probability entries, the script uses a confluence of three technical layers:
MACD-Bollinger Breakout: Unlike standard MACD, this script signals an entry when the MACD line breaks outside its own Bollinger Band. This represents a surge in volatility that is statistically significant.
The Trend Shield (EMA 200): Only allows "Buy" signals when the price is above the 200 EMA and "Sell" signals when below. This keeps you on the right side of the institutional trend.
Momentum Confirmation (RSI): Signals are further filtered by the RSI (Relative Strength Index). Buys are only valid when RSI > 50, and Sells when RSI < 50, ensuring the "wind is at your back."
Key Features
Adaptive MACD: The MACD line changes color dynamically (Lime for Bullish Breakout, Red for Bearish Breakout).
Visual Signal Cues: The chart background highlights in Lime for Buys and Red for Sells. Additionally, the bars turn Yellow/Aqua to ensure you never miss a candle close entry.
Fully Customizable: You can toggle the EMA and RSI filters On/Off in the settings to adapt the script for "Contrarian/Reversal" trading or strict "Trend Following."
Gold Optimized: Tuned specifically for the fast-paced movements of XAUUSD.
How to Use
🟢 LONG Entry: Price > 200 EMA + RSI > 50 + MACD crosses above Upper Bollinger Band.
🔴 SHORT Entry: Price < 200 EMA + RSI < 50 + MACD crosses below Lower Bollinger Band.
Recommended Timeframes: M1, M5, and M15 for Scalping. H1 for Day Trading.
Parameters
MACD Lengths: Standard 12/26 (Adjustable).
BB Deviations: Default 1.0 (Tight for scalping). Increase to 1.5 or 2.0 for a more conservative approach.
Filter Toggle: Switch Use EMA & RSI Filters? to False if you want to see every MACD-BB breakout regardless of the main trend. 指標

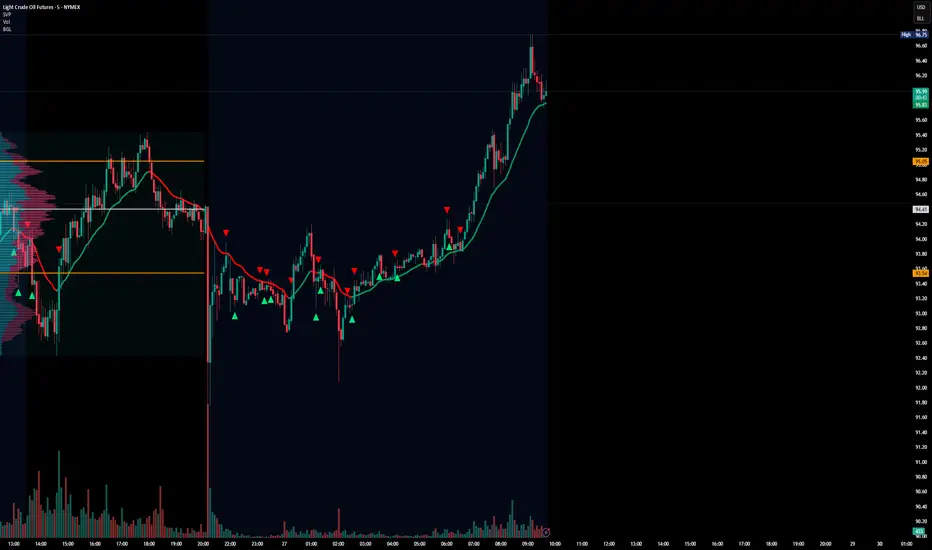
NORN WEAVE | FEHUOverview
NORN WEAVE ᚠ FEHU is a trend-following strategy built around one philosophy: survival first, profit second.
The core logic is three filters in sequence — EMA slope, Dow Theory swing structure, and ADX trend confirmation. All three must align before an entry is taken. If the market is ranging, the strategy stands aside.
What defines NORN WEAVE is how it protects what it earns. The Break Even Stop automatically moves the stop to entry price once floating profit reaches a threshold. The Footprint Delta Filter adds a second layer, blocking entries when BTC or ETH order flow contradicts the trade direction. Fewer trades. Fewer unnecessary losses. A drawdown profile that stays flat even across five years of volatile crypto markets.
This is not a strategy designed to make you rich overnight. It is designed to keep you in the game.
Performance Highlights (DOGE / 2H / 2021–2026)
Backtested on DOGE 2H from January 2021 to March 2026, with 0.055% commission included. Net profit +25.4%, max drawdown 1.71%, win rate 70.7%, profit factor 1.80, total trades 557.
Always backtest on your target asset before live trading.
Entry Conditions
Long: EMA rising AND Dow Theory trend up AND ADX above threshold.
Short: EMA falling AND Dow Theory trend down AND ADX above threshold.
Exit Conditions
TP1 triggers at ATR × Factor × 1, closing 30% of the position. TP2 at × 2, closing another 30%. TP3 at × 3, closing a further 30%. The Stop Loss closes the full position at a fixed percentage from entry. The Break Even Stop automatically triggers once floating profit reaches the BE threshold, closing the full position at entry price. A Trend Reversal — when Dow Theory swing flips — also closes the full position.
Footprint Delta Filter (Premium plan required)
Uses BTC or ETH footprint delta (buy volume − sell volume) as a directional confirmation filter. Blocks entries when order flow contradicts the trade direction. Meaningful reduction in false signals during ranging markets.
Parameters
EMA Period defaults to 58, recommended range 30–100. Use shorter values for high-volatility assets, longer for stable ones.
ATR Factor defaults to 3.8, recommended range 2.5–6.0. Controls TP distance — higher means wider targets.
Stop Loss defaults to -5.0%, recommended range -4 to -10%. Wider for volatile assets, tighter for BTC/ETH.
ADX Threshold defaults to 20.5, recommended range 15–28. Higher values produce fewer but cleaner trades.
Swing Length defaults to 13, recommended range 2–20. Larger values reduce sensitivity to minor swings.
BE Trigger defaults to 9.0%, recommended range 3–15%. Set below TP1 distance to protect profits before TP1 is reached.
Footprint Delta SMA defaults to 21, recommended range 1–50. Controls smoothing of the delta signal.
Recommended Settings
For meme coins such as DOGE and SHIB: EMA 44–58, ATR 3.5–5.0, stop loss -5 to -8%, ADX 18–22, BE trigger 7–10%.
For major assets such as BTC and ETH: EMA 55–80, ATR 2.5–4.0, stop loss -4 to -6%, ADX 20–25, BE trigger 5–8%.
For mid-cap alts such as SOL and SUI: EMA 35–55, ATR 4.0–5.5, stop loss -5 to -7%, ADX 18–23, BE trigger 6–10%.
For timeframe selection, an ADX threshold of 15–20 suits 1–5 minute charts. 18–23 suits 15 minutes to 1 hour. 20–25 suits 2–4 hour charts. Default settings are optimized for the 2H timeframe.
Visual Guide
The EMA line uses a 3-layer glow effect — teal when rising, red when falling. Dow Theory zones show a gradient from the current swing level to the current price. TP lines are semi-transparent, with TP1 the faintest and TP3 the most visible. The BE Stop line appears in gold only when the break even stop is active. A gray background indicates ADX is below the threshold — the strategy does not enter trades in this zone. An orange background means the Footprint Delta Filter is blocking entry. The status table shows all entry conditions and current state in real time, with a Japanese/English toggle.
概要
NORN WEAVE ᚠ FEHU は、「まず生き残る、利益はその次」 という一つの哲学から作られたトレンドフォロー型ストラテジーです。
エントリー条件はシンプルな3つのフィルターで構成されています——EMAの傾き、ダウ理論のスイング構造、ADXトレンドフィルター。この3つが同時に揃ったときだけエントリーします。レンジ相場と判断されたときは、何もせずに待ちます。
NORN WEAVEを特徴づけているのは、稼いだ利益をどう守るかという設計です。ブレークイーブンストップは、含み益が一定の閾値に達した瞬間に損切りラインをエントリー価格へ自動移動します。フットプリント・デルタフィルターはBTCまたはETHのオーダーフローを確認し、トレードの方向と逆行している場合はエントリーをブロックします。結果としてトレード数は絞られ、不要な損失が減り、ドローダウンが5年間の荒れた暗号資産市場でも極めて小さく抑えられています。
一夜にして資産を増やすストラテジーではありません。長くゲームに居続けるためのストラテジーです。
バックテスト結果
DOGEの2時間足、2021年1月から2026年3月まで、手数料0.055%を含む条件でバックテストを実施しています。総損益は+25.4%、最大ドローダウンは1.71%、勝率は70.7%、プロフィットファクターは1.80、トレード総数は557件です。
実運用の前に必ずご自身の対象銘柄でバックテストを行ってください。
エントリー条件
ロングエントリーはEMAが上向き、ダウ理論トレンドが上昇、ADXがしきい値以上の3条件が揃ったときに発動します。ショートエントリーはEMAが下向き、ダウ理論トレンドが下降、ADXがしきい値以上の3条件が揃ったときに発動します。
イグジット条件
TP1はエントリーからATR×倍率×1の地点でポジションの30%を決済します。TP2は×2の地点でさらに30%、TP3は×3の地点でさらに30%を決済します。損切りは設定した%を超えた時点でポジションを全決済します。ブレークイーブンストップは含み益がしきい値%に達した瞬間に自動発動し、エントリー価格でポジションを全決済します。ダウ理論のスイングが逆転したトレンド反転時も、ポジションを全決済します。
フットプリント・デルタフィルター(Premiumプラン以上が必要)
BTCまたはETHのフットプリント・デルタ(買い出来高から売り出来高を引いた値)を方向性確認フィルターとして使用します。オーダーフローがトレードの方向と逆行しているときはエントリーをブロックします。横ばい相場でのだましシグナルを大幅に削減します。
パラメーター
EMA期間のデフォルトは58で、推奨範囲は30〜100です。ボラティリティが高い銘柄は短め、安定した銘柄は長めに設定します。
ATR倍率のデフォルトは3.8で、推奨範囲は2.5〜6.0です。TP距離の基準となる値で、大きいほど利確ラインが遠くなります。
損切りのデフォルトは-5.0%で、推奨範囲は-4〜-10%です。ボラティリティが高い銘柄は広め、BTC・ETHなどはタイトに設定します。
ADXしきい値のデフォルトは20.5で、推奨範囲は15〜28です。高いほどトレード数が減り、精度が上がります。
スイング検出期間のデフォルトは13で、推奨範囲は2〜20です。大きいほど小さなスイングに反応しにくくなります。
BE発動しきい値のデフォルトは9.0%で、推奨範囲は3〜15%です。TP1到達距離より低めに設定することで、TP1到達前に元本を保護できます。
フットプリントSMA期間のデフォルトは21で、推奨範囲は1〜50です。デルタシグナルの平滑化期間です。
銘柄タイプ別おすすめ設定
ミーム系銘柄(DOGE・SHIBなど)ではEMAを44〜58、ATR倍率を3.5〜5.0、損切りを-5〜-8%、ADXしきい値を18〜22、BEトリガーを7〜10%に設定することを推奨します。
主要銘柄(BTC・ETH)ではEMAを55〜80、ATR倍率を2.5〜4.0、損切りを-4〜-6%、ADXしきい値を20〜25、BEトリガーを5〜8%に設定することを推奨します。
中堅アルト(SOL・SUIなど)ではEMAを35〜55、ATR倍率を4.0〜5.5、損切りを-5〜-7%、ADXしきい値を18〜23、BEトリガーを6〜10%に設定することを推奨します。
時間足については、1〜5分足ではADXしきい値を15〜20、15分〜1時間足では18〜23、2〜4時間足では20〜25に設定することを推奨します。デフォルト設定はDOGEの2時間足向けに最適化されています。
チャートの見方
EMAラインは3層のグロー効果で描画されます。上向きのときはティール、下向きのときはレッドで表示されます。ダウ理論ゾーンは現在のスイングレベルから現在価格へ向かうグラデーションで表示されます。TPラインは半透明で、TP1が最も薄く、TP3が最も濃く表示されます。BEストップラインはブレークイーブンストップが発動している間のみゴールドのラインで表示されます。グレーの背景はADXがしきい値以下の横ばいゾーンを示しており、このゾーンではエントリーは発生しません。オレンジの背景はフットプリント・デルタフィルターがエントリーをブロックしていることを示します。ステータステーブルは全エントリー条件と現在の状態をリアルタイムで表示し、日本語・英語の切り替えに対応しています。
デフォルト設定はDOGEの2時間足向けに最適化されています。実運用の前に必ずご自身の対象銘柄・時間足でバックテストを行ってください。過去の結果は将来の利益を保証するものではありません。
NORN WEAVEは今後も継続的にアップデートされます。ただし、コアコンセプト——生き残ること——は変わりません。
策略

指標
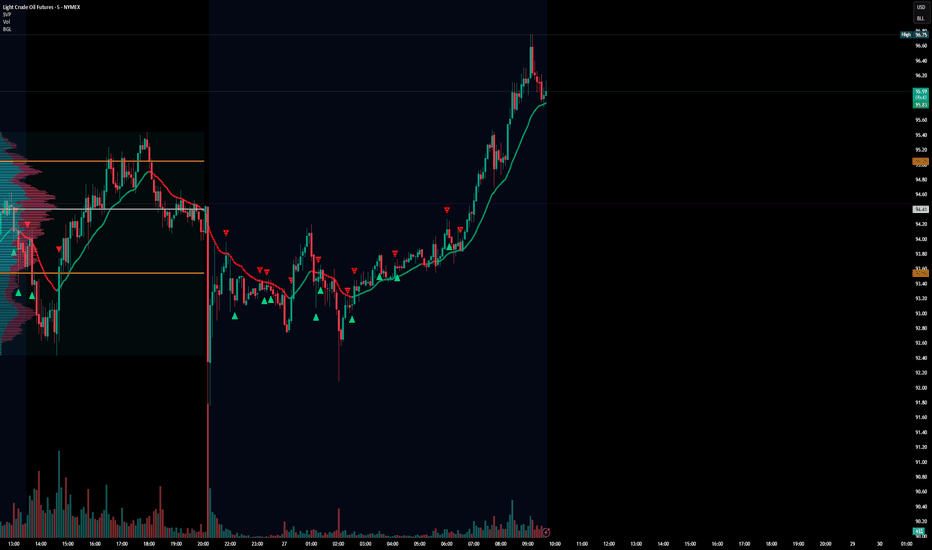
指標
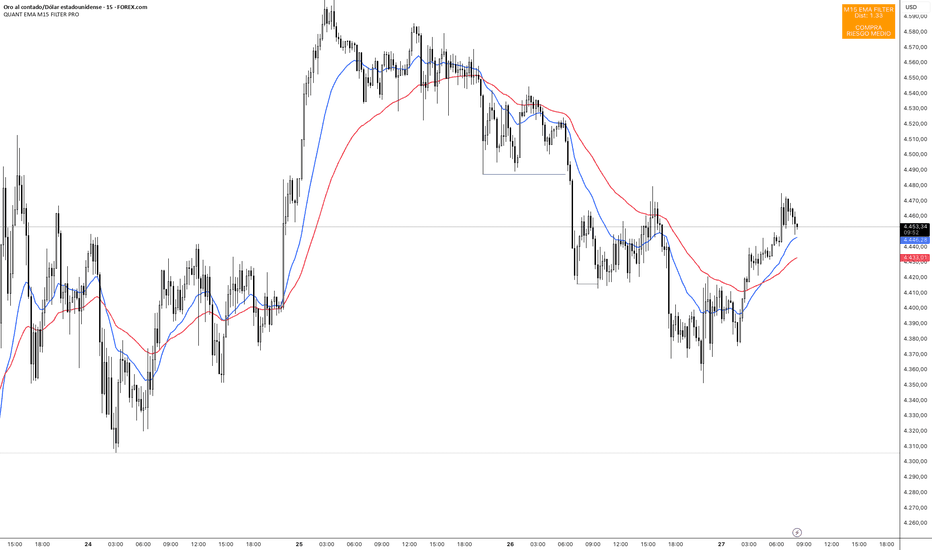
160-Min Extended Hours MAs160-Min Extended Hours MA Dashboard
Designed for traders who work across the full extended hours session, where 960 minutes of daily market time — from pre-market open at 4:00 AM ET through post-market close at 8:00 PM ET — divides evenly into exactly 6 bars per day at the 160-minute timeframe. This creates a clean, session-aligned bar structure that keeps moving average lookbacks anchored to real extended hours time rather than arbitrary period counts.
This indicator plots five moving averages, each mapped to a meaningful horizon expressed in session time:
1D — 6 bars (1 full extended session)
1W — 30 bars (1 trading week)
1M — 126 bars (~1 trading month)
6M — 756 bars (~6 trading months)
1Y — 1,512 bars (~1 trading year)
Features
Toggle between EMA and SMA globally with a single input. Each MA plots with a right-edge label showing the period name, distance from current price, percentage distance, and ATR multiple — giving you immediate context on how extended or compressed price is relative to each level. A summary table displays the current MA value and slope direction (▲ ▼ →) for each period. A bottom signal row indicates whether price is in a full bull stack, bear stack, or mixed alignment across all visible MAs.
Color palette runs teal → light blue → royal blue → purple → white from shortest to longest timeframe, consistent with the broader dashboard suite.
The indicator includes a timeframe guard — all plots and labels suppress automatically if the chart is not on the 160-minute timeframe, and a warning label fires to prompt you to switch. Note that the 1Y MA requires approximately one full year of chart history to populate.
Timeframe: 160-min only
Asset class: Equities, ETFs, and index products with extended hours trading (4:00 AM – 8:00 PM ET)
Pine Script: v6
Sonnet 4.6 指標

5-Min Session MAsHere's the updated description:
---
**5-Min Session MA Dashboard**
Designed for intraday traders working on the 5-minute timeframe, where 390 minutes of regular trading hours divides into exactly 78 bars per day — keeping moving average lookbacks anchored to real session time rather than arbitrary period counts.
This indicator plots three moving averages, each mapped to a meaningful intraday horizon expressed in session time:
- 1D — 78 bars (1 full session)
- 2D — 156 bars (2 sessions)
- 1W — 390 bars (1 trading week)
**Features**
Toggle between EMA and SMA globally with a single input. Each MA plots with a right-edge label showing the period name, distance from current price, percentage distance, and ATR multiple — giving you immediate context on how extended or compressed price is relative to each level. A summary table displays the current MA value and slope direction (▲ ▼ →) for each period. A bottom signal row indicates whether price is in a full bull stack, bear stack, or mixed alignment across all visible MAs.
Color palette runs teal → blue → purple from shortest to longest timeframe, consistent with the broader dashboard suite.
The indicator includes a timeframe guard — all plots and labels suppress automatically if the chart is not on the 5-minute timeframe, and a warning label fires to prompt you to switch.
**Timeframe:** 5-min only
**Asset class:** Equities, ETFs, and index products trading regular hours (9:30–4:00 ET)
**Pine Script:** v6
--- 指標

138-Min Session MAs138-Min Session MA Dashboard
Designed for futures traders using the 138-minute timeframe, where 1,380 minutes of daily session time divides evenly into exactly 10 bars per day — creating a clean, session-aligned bar structure unique to this timeframe.
This indicator plots six moving averages, each mapped to a meaningful trading horizon expressed in session-time rather than calendar time:
1D — 10 bars (1 session)
2D — 20 bars (2 sessions)
1W — 50 bars (1 trading week)
2W — 100 bars (2 trading weeks)
1M — 210 bars (~1 trading month)
6M — 1,260 bars (~6 trading months)
Features
Toggle between EMA and SMA globally with a single input. Each MA plots with a right-edge label showing the period name, distance from current price, percentage distance, and ATR multiple — giving you immediate context on how extended or compressed price is relative to each level. A summary table displays the current MA value and slope direction (▲ ▼ →) for each period. A bottom signal row indicates whether price is in a full bull stack, bear stack, or mixed alignment across all visible MAs.
Color palette runs teal → blue → purple → white from shortest to longest timeframe, consistent with the broader dashboard suite.
The indicator includes a timeframe guard — all plots and labels suppress automatically if the chart is not on the 138-minute timeframe, and a warning label fires to prompt you to switch.
Timeframe: 138-min only
Asset class: Futures (ES, NQ, CL, GC, or any instrument with a 1,380-min session)
Pine Script: v6 指標

Trifecta Supertrend Indicator Description: Triple Supertrend + EMAs + VWAP + Signals
This indicator combines trend-following and momentum filters to identify high-probability buy and sell signals:
Triple Supertrend Lines:
Fast (10,1), Medium (11,2), Slow (12,3)
Green = bullish, Red = bearish
Signals are generated only when all three Supertrends align, reducing false entries.
EMAs:
9 EMA (white) – short-term momentum
21 EMA (light blue) – medium-term trend
200 EMA (dark red) – long-term trend reference
VWAP (blue):
Auto-anchored, provides dynamic support/resistance
Ensures trades align with intraday value zone
Buy Signal Conditions:
All three Supertrend lines are green
9 EMA > 21 EMA (short-term momentum confirming trend)
Price above VWAP
Sell Signal Conditions:
All three Supertrend lines are red
9 EMA < 21 EMA
Price below VWAP
Dynamic Take Profit (TP) and Stop Loss (SL):
SL: Just beyond slowest Supertrend line (12,3) ± 1 ATR
TP: 1.5 × SL distance from entry, plotted for visual guidance
Visual SL = red line, TP = green line
Allows risk:reward = 1:1.5 per trade 指標
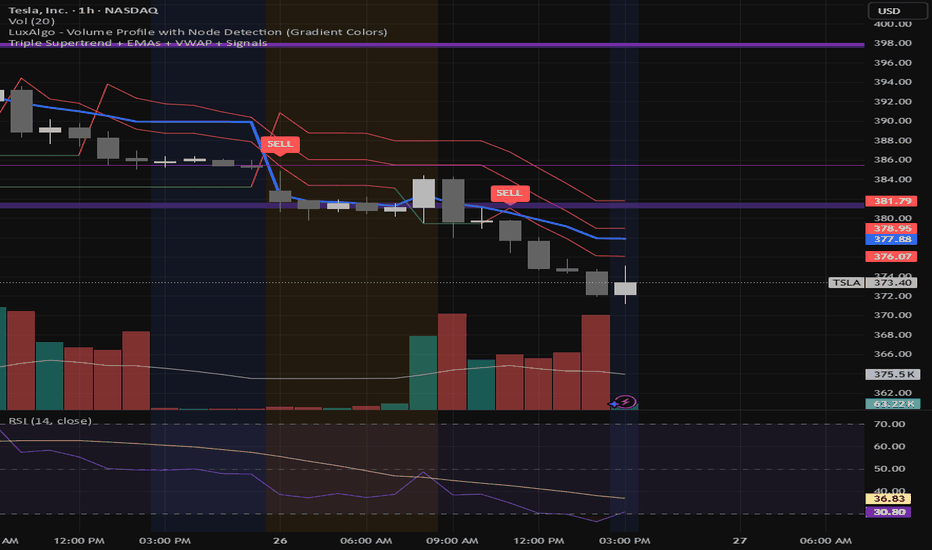
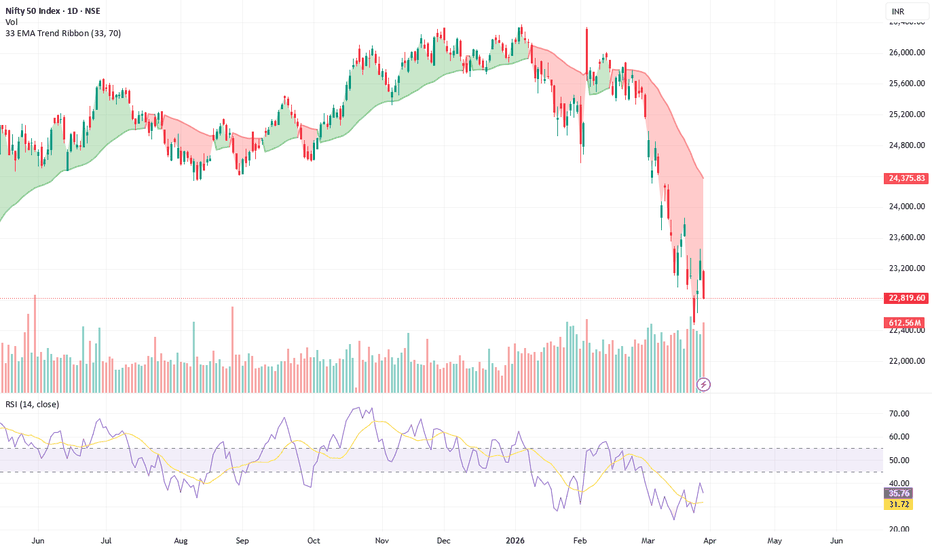
Scalping Smoothed Heikin Ashi with EMA Crossover[JAYADEV RANA]Short summary
This overlay plots double-smoothed Heikin Ashi candles (EMA-smoothed inputs, then EMA-smoothed HA outputs) to reduce noise and make short-term direction changes easier to see. It also includes a standard fast/slow EMA pair for crossover confirmation. Signals are provided for HA color flips and EMA crossovers, with optional EMA plotting and alert conditions for all events.
Full description
Overview
This script is a scalping-oriented visual overlay that combines two views of momentum:
Smoothed Heikin Ashi candles to clarify candle structure and reduce choppiness, and
EMA crossovers on the standard close for a secondary trend/confirmation layer.
The indicator is designed to help you read short-term regime changes quickly without relying on raw candles alone.
How to use
Primary read (Smoothed HA candles):
Bullish candles: shaClose > shaOpen (colored with the Bullish Color).
Bearish candles: shaClose < shaOpen (colored with the Bearish Color).
A triangle prints when the candle state flips:
Up triangle below bar on bullish flip
Down triangle above bar on bearish flip
Confirmation read (EMA crossovers):
“Gold Cross”: fast EMA crosses above slow EMA
“Death Cross”: fast EMA crosses below slow EMA
EMAs can be toggled on/off via Show EMAs.
A common workflow is to treat the HA color flip as the timing trigger and use the EMA crossover as trend confirmation (or to filter trades in choppy sessions). Alternatively, you can invert that: use EMA trend as the regime and take only HA flips that align with it.
Method details
Smoothed Heikin Ashi pipeline (two-stage smoothing):
Pre-smooth raw OHLC using EMA with Pre-Smoothing Period.
Compute Heikin Ashi from the smoothed OHLC:
HA close is the average of smoothed OHLC
HA open is recursively smoothed using prior HA values
HA high/low are derived from smoothed extremes and HA open/close
Post-smooth HA OHLC again using EMA with Post-Smoothing Period.
Plot candles using the post-smoothed HA values.
EMA crossover layer:
Fast EMA = EMA(close, Fast EMA Length)
Slow EMA = EMA(close, Slow EMA Length)
Crossovers are detected with ta.crossover() / ta.crossunder().
Signals & alerts
HA bullish change: Smoothed HA flips from bearish to bullish
HA bearish change: Smoothed HA flips from bullish to bearish
EMA bullish cross: fast EMA crosses above slow EMA
EMA bearish cross: fast EMA crosses below slow EMA
All four have built-in alertcondition() entries.
Settings
Pre-Smoothing Period: How much to smooth the raw OHLC before HA is computed.
Higher = smoother, fewer flips, more lag.
Post-Smoothing Period: How much to smooth the HA candles after computation.
Higher = cleaner candle blocks, more lag.
Fast / Slow EMA Lengths: Controls crossover sensitivity.
Wider gap (e.g., 10/30) = slower but fewer crosses.
Tighter gap (e.g., 9/18) = faster but more noise.
Style: Bull/Bear colors + EMA visibility toggle.
Limitations / caveats
Smoothed HA is intentionally lagging compared to raw candles; it’s built to reduce noise, not to predict turns early.
In ranging markets, both HA flips and EMA crossovers can whipsaw. Consider additional context (structure, session, volatility) or higher timeframe bias.
Alerts can trigger intrabar in real time and may differ from the final closed-bar state (standard TradingView behavior).
Screenshot prompt pack
Trend session example: A clean directional move on a lower timeframe (e.g., 5m/15m) showing extended same-color Smoothed HA candles with a supportive EMA alignment.
Flip + confirmation example: A sequence where HA flips bullish and the EMA gold cross happens shortly after; annotate as “trigger + confirmation.”
Chop warning example: A sideways segment where HA flips multiple times and EMAs cross back and forth; caption as a limitation (range whipsaw).
Sensitivity comparison: Same symbol/timeframe with (a) low smoothing periods and (b) higher smoothing periods to show the lag vs noise tradeoff. 指標

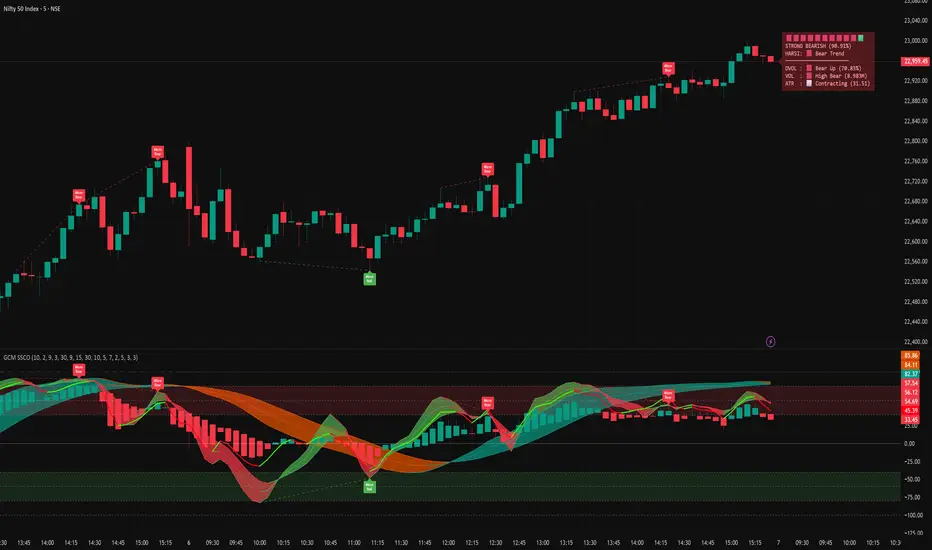
GCM SMI Cloud OscillatorDescription:
Title: GCM Smart SMI Cloud Oscillator (GCM SSCO)
Advanced Cloud Dynamics Meets Absolute Algorithmic Precision.
- by uniGram.
Overview
Traditional oscillators often fall victim to market noise, generating false signals and whipsawing traders during chop. The GCM Smart SMI Cloud Oscillator (GCM SSCO) was engineered to solve this by moving away from basic crossovers and utilizing an algorithmic 9-Point Confluence Engine.
By calculating the momentum of both Micro (fast) and Macro (slow) cycles alongside a hidden exponential moving average framework, the GCM SSCO filters out institutional stop-hunts and provides highly accurate, trend-aligned signals.
🧠 The 9-Point Smart Engine
At the core of the GCM SSCO is a dynamic scoring algorithm. Under the hood, the indicator continuously grades the market based on 9 specific criteria:
1-3. Micro SMI, Signal, and Sniper Trajectories
4-6. Macro SMI, Signal, and Sniper Trajectories
7-9. Hidden EMA 1, EMA 2, and Mean Trajectories
The Smart Label Dashboard (top center) displays this internal score in real-time, instantly calculating the absolute momentum percentage. It requires heavy confluence (8 out of 9 points) to shift into "STRONG BULLISH" or "STRONG BEARISH" status, keeping you out of weak, low-probability setups.
⚙️ Core Architecture & Features
• Dual-Cloud Dynamics: Features two distinct Stochastic Momentum Index (SMI) clouds. The Macro Cloud defines the overarching institutional trend, while the Micro Cloud acts as your trigger for high-precision entries.
• Automated Divergence Detection: Built-in pivot-lookback algorithms automatically map out Bullish and Bearish divergences on both the Micro and Macro levels. These print directly on the oscillator to signal early trend exhaustion.
• Institutional OB/OS Zones: Features perfectly calibrated, low-opacity (20%) structural lines. The overbought (+40 to +80) and oversold (-40 to -80) zones are subtly tinted red and green to visually alert you when momentum is overextended and ripe for a mean-reversion.
• Clean Visuals: Meticulously designed UI. No chart clutter. The indicator relies on smooth ribbon fills, clean dashed boundaries, and a minimalist square-capsule HUD.
📈 How to Trade with the GCM SSCO
1. The "Cloud Confluence" Strategy (Trend Following)
• Long Entry: Wait for the Macro Cloud to turn Bullish (Green). Enter when the Micro Cloud pulls back and prints a fresh Bullish crossover in the direction of the Macro trend.
• Short Entry: Wait for the Macro Cloud to turn Bearish (Red). Enter when the Micro Cloud rallies and prints a fresh Bearish crossover in sync with the Macro trend.
2. The "Momentum Sniper" Strategy (Breakouts)
• Watch the Smart Dashboard. When the market transitions from ranging to "STRONG BULLISH" (85%+ Momentum) or "STRONG BEARISH", use this as a trigger to scale into breakout trades before the wider market reacts.
3. Exhaustion & Exits
• When the Micro SMI pushes into the Extreme Tinted Zones (+80 or -80) AND prints a Divergence label, look to take profits or tighten trailing stop losses.
🔔 Built-In Pro Alerts
The GCM SSCO comes fully loaded with high-probability alert conditions:
• 🔥 Strong Bullish / 🩸 Strong Bearish Momentum: Fires strictly when the 9-Point Engine detects massive alignment (8+ indicators in sync).
• 🟢 Cloud Confluence (Bullish/Bearish): Fires the exact moment both the Micro and Macro clouds synchronize, signaling a unified shift in market direction.
⚠️ Disclaimer & Risk Warning:
The GCM Smart SMI Cloud Oscillator (SSCO) is an analytical tool provided for educational and informational purposes only. It does not constitute financial or investment advice. Trading in financial markets (crypto, forex, stocks, options) involves a high degree of risk and may not be suitable for all investors. Past performance of any indicator or trading system is not indicative of future results. Always conduct your own due diligence, rigorously backtest any strategy, and employ strict risk management. The author assumes no responsibility or liability for any financial losses incurred while using this script.
HAPPY TRADING
________________________________________
Description in Kannada Language (ಕನ್ನಡ ವಿವರಣೆ)
TITLE: GCM ಸ್ಮಾರ್ಟ್ SMI ಕ್ಲೌಡ್ ಆಸಿಲೇಟರ್ (GCM SSCO)
ಸುಧಾರಿತ ಕ್ಲೌಡ್ ಡೈನಾಮಿಕ್ಸ್ ಮತ್ತು ನಿಖರವಾದ ಅಲ್ಗಾರಿದಮಿಕ್ ಲೆಕ್ಕಾಚಾರಗಳ ಅದ್ಭುತ ಸಂಯೋಜನೆ.
- by uniGram.
ಅವಲೋಕನ (Overview)
ಸಾಂಪ್ರದಾಯಿಕ ಆಸಿಲೇಟರ್ಗಳು (oscillators) ಸಾಮಾನ್ಯವಾಗಿ ಮಾರ್ಕೆಟ್ ನಾಯ್ಸ್ (market noise) ಗೆ ಬಲಿಯಾಗುತ್ತವೆ, ಫೇಕ್ ಸಿಗ್ನಲ್ಗಳನ್ನು ನೀಡುತ್ತವೆ ಮತ್ತು ಚಾಪಿ (choppy) ಮಾರ್ಕೆಟ್ನಲ್ಲಿ ಟ್ರೇಡರ್ಗಳಿಗೆ ನಷ್ಟ ಉಂಟುಮಾಡುತ್ತವೆ. GCM ಸ್ಮಾರ್ಟ್ SMI ಕ್ಲೌಡ್ ಆಸಿಲೇಟರ್ (GCM SSCO) ಅನ್ನು ಈ ಸಮಸ್ಯೆಯನ್ನು ಬಗೆಹರಿಸಲು ವಿನ್ಯಾಸಗೊಳಿಸಲಾಗಿದೆ. ಇದು ಕೇವಲ ಬೇಸಿಕ್ ಕ್ರಾಸ್ಓವರ್ಗಳನ್ನು ಅವಲಂಬಿಸದೆ, ಸುಧಾರಿತ 9-ಪಾಯಿಂಟ್ ಕಾನ್ಫ್ಲುಯೆನ್ಸ್ ಎಂಜಿನ್ (9-Point Confluence Engine) ಅನ್ನು ಬಳಸುತ್ತದೆ.
ಮೈಕ್ರೋ (Micro - ವೇಗ) ಮತ್ತು ಮ್ಯಾಕ್ರೋ (Macro - ನಿಧಾನ) ಸೈಕಲ್ಗಳ ಮೊಮೆಂಟಮ್ ಜೊತೆಗೆ ಹಿಡನ್ (hidden) ಎಕ್ಸ್ಪೋನೆನ್ಷಿಯಲ್ ಮೂವಿಂಗ್ ಆವರೇಜ್ (EMA) ಫ್ರೇಮ್ವರ್ಕ್ ಅನ್ನು ಲೆಕ್ಕಾಚಾರ ಮಾಡುವ ಮೂಲಕ, GCM SSCO ಸಾಂಸ್ಥಿಕ (institutional) ಸ್ಟಾಪ್-ಹಂಟ್ಗಳನ್ನು ಫಿಲ್ಟರ್ ಮಾಡುತ್ತದೆ ಮತ್ತು ಟ್ರೆಂಡ್ಗೆ ಅನುಗುಣವಾದ ಹೆಚ್ಚು ನಿಖರವಾದ ಸಿಗ್ನಲ್ಗಳನ್ನು ಒದಗಿಸುತ್ತದೆ.
🧠 9-ಪಾಯಿಂಟ್ ಸ್ಮಾರ್ಟ್ ಎಂಜಿನ್ (The 9-Point Smart Engine)
GCM SSCO ನ ಪ್ರಮುಖ ಭಾಗವೆಂದರೆ ಡೈನಾಮಿಕ್ ಸ್ಕೋರಿಂಗ್ ಅಲ್ಗಾರಿದಮ್. ಇದು 9 ನಿರ್ದಿಷ್ಟ ಮಾನದಂಡಗಳ ಆಧಾರದ ಮೇಲೆ ಮಾರ್ಕೆಟ್ ಅನ್ನು ನಿರಂತರವಾಗಿ ಗ್ರೇಡ್ ಮಾಡುತ್ತದೆ:
1-3. ಮೈಕ್ರೋ SMI, ಸಿಗ್ನಲ್ ಮತ್ತು ಸ್ನೈಪರ್ ಟ್ರಾಜೆಕ್ಟರಿಗಳು (Trajectories)
4-6. ಮ್ಯಾಕ್ರೋ SMI, ಸಿಗ್ನಲ್ ಮತ್ತು ಸ್ನೈಪರ್ ಟ್ರಾಜೆಕ್ಟರಿಗಳು
7-9. ಹಿಡನ್ EMA 1, EMA 2, ಮತ್ತು ಮೀನ್ (Mean) ಟ್ರಾಜೆಕ್ಟರಿಗಳು
ಸ್ಮಾರ್ಟ್ ಲೇಬಲ್ ಡ್ಯಾಶ್ಬೋರ್ಡ್ (Smart Label Dashboard) (ಮೇಲ್ಭಾಗದ ಮಧ್ಯದಲ್ಲಿ): ಈ ಇಂಟರ್ನಲ್ ಸ್ಕೋರ್ ಅನ್ನು ರಿಯಲ್-ಟೈಮ್ನಲ್ಲಿ ಪ್ರದರ್ಶಿಸುತ್ತದೆ, ಇದು ಒಟ್ಟು ಮೊಮೆಂಟಮ್ ಶೇಕಡಾವಾರು (percentage) ಅನ್ನು ತಕ್ಷಣವೇ ಲೆಕ್ಕಾಚಾರ ಮಾಡುತ್ತದೆ. "ಸ್ಟ್ರಾಂಗ್ ಬುಲ್ಲಿಶ್ (STRONG BULLISH)" ಅಥವಾ "ಸ್ಟ್ರಾಂಗ್ ಬೇರಿಶ್ (STRONG BEARISH)" ಸ್ಟೇಟಸ್ಗೆ ಬದಲಾಗಲು ಇದು ಬಲವಾದ ಕಾನ್ಫ್ಲುಯೆನ್ಸ್ ಅನ್ನು (9 ರಲ್ಲಿ 8 ಪಾಯಿಂಟ್ಗಳು) ನಿರೀಕ್ಷಿಸುತ್ತದೆ, ಇದು ನಿಮ್ಮನ್ನು ದುರ್ಬಲ, ಕಡಿಮೆ-ಪ್ರಾಬಬಿಲಿಟಿ (low-probability) ಸೆಟಪ್ಗಳಿಂದ ದೂರವಿಡುತ್ತದೆ.
⚙️ ಕೋರ್ ಆರ್ಕಿಟೆಕ್ಚರ್ ಮತ್ತು ವೈಶಿಷ್ಟ್ಯಗಳು (Core Architecture & Features)
• ಡ್ಯುಯಲ್-ಕ್ಲೌಡ್ ಡೈನಾಮಿಕ್ಸ್ (Dual-Cloud Dynamics): ಎರಡು ವಿಭಿನ್ನ ಸ್ಟೊಕಾಸ್ಟಿಕ್ ಮೊಮೆಂಟಮ್ ಇಂಡೆಕ್ಸ್ (SMI) ಕ್ಲೌಡ್ಗಳನ್ನು ಹೊಂದಿದೆ. ಮ್ಯಾಕ್ರೋ ಕ್ಲೌಡ್ ಪ್ರಮುಖ ಸಾಂಸ್ಥಿಕ (institutional) ಟ್ರೆಂಡ್ ಅನ್ನು ವ್ಯಾಖ್ಯಾನಿಸುತ್ತದೆ, ಆದರೆ ಮೈಕ್ರೋ ಕ್ಲೌಡ್ ನಿಮ್ಮ ಹೈ-ಪ್ರೆಸಿಶನ್ ಎಂಟ್ರಿಗಳಿಗೆ ಟ್ರಿಗರ್ ಆಗಿ ಕಾರ್ಯನಿರ್ವಹಿಸುತ್ತದೆ.
• ಆಟೋಮ್ಯಾಟೆಡ್ ಡೈವರ್ಜೆನ್ಸ್ ಡಿಟೆಕ್ಷನ್ (Automated Divergence Detection): ಇದರಲ್ಲಿರುವ ಪಿವಾಟ್-ಲುಕ್ಬ್ಯಾಕ್ ಅಲ್ಗಾರಿದಮ್ಗಳು ಮೈಕ್ರೋ ಮತ್ತು ಮ್ಯಾಕ್ರೋ ಹಂತಗಳಲ್ಲಿ ಬುಲ್ಲಿಶ್ ಮತ್ತು ಬೇರಿಶ್ ಡೈವರ್ಜೆನ್ಸ್ಗಳನ್ನು ಸ್ವಯಂಚಾಲಿತವಾಗಿ ಮ್ಯಾಪ್ ಮಾಡುತ್ತವೆ. ಟ್ರೆಂಡ್ ಎಕ್ಸಾಶನ್ (trend exhaustion) ಅನ್ನು ಮೊದಲೇ ಸೂಚಿಸಲು ಇವು ಆಸಿಲೇಟರ್ ಮೇಲೆಯೇ ಪ್ರಿಂಟ್ ಆಗುತ್ತವೆ.
• ಇನ್ಸ್ಟಿಟ್ಯೂಷನಲ್ OB/OS ಝೋನ್ಗಳು (Institutional OB/OS Zones): ಕರಾರುವಕ್ಕಾಗಿ ಲೆಕ್ಕಾಚಾರ ಮಾಡಿದ, ಕಡಿಮೆ-ಒಪಾಸಿಟಿ (20%) ಸ್ಟ್ರಕ್ಚರಲ್ ಲೈನ್ಗಳನ್ನು ಹೊಂದಿದೆ. ಓವರ್ಬಾಟ್ (Overbought: +40 ರಿಂದ +80) ಮತ್ತು ಓವರ್ಸೋಲ್ಡ್ (Oversold: -40 ರಿಂದ -80) ಝೋನ್ಗಳು ಕ್ರಮವಾಗಿ ಕೆಂಪು ಮತ್ತು ಹಸಿರು ಬಣ್ಣದ ಟಿಂಟ್ (tint) ಹೊಂದಿದ್ದು, ಮೊಮೆಂಟಮ್ ಓವರ್ಎಕ್ಸ್ಟೆಂಡ್ ಆದಾಗ ಮತ್ತು ರಿವರ್ಸಲ್ (mean-reversion) ಗೆ ಸಿದ್ಧವಾದಾಗ ನಿಮಗೆ ದೃಷ್ಟಿಗೋಚರವಾಗಿ (visually) ಅಲರ್ಟ್ ಮಾಡುತ್ತವೆ.
• ಕ್ಲೀನ್ ವಿನ್ಯಾಸ (Clean Visuals): ಬಹಳ ಎಚ್ಚರಿಕೆಯಿಂದ ವಿನ್ಯಾಸಗೊಳಿಸಿದ UI. ಚಾರ್ಟ್ ಮೇಲೆ ಯಾವುದೇ ಗೊಂದಲವಿರುವುದಿಲ್ಲ (No chart clutter). ಈ ಇಂಡಿಕೇಟರ್ ಸ್ಮೂತ್ ರಿಬ್ಬನ್ ಫಿಲ್ಗಳು, ಕ್ಲೀನ್ ಡ್ಯಾಶ್ಡ್ ಬೌಂಡರಿಗಳು ಮತ್ತು ಮಿನಿಮಲಿಸ್ಟ್ ಸ್ಕ್ವೇರ್-ಕ್ಯಾಪ್ಸುಲ್ HUD ಮೇಲೆ ಅವಲಂಬಿತವಾಗಿದೆ.
📈 GCM SSCO ಬಳಸಿ ಟ್ರೇಡ್ ಮಾಡುವುದು ಹೇಗೆ (How to Trade)
1. "ಕ್ಲೌಡ್ ಕಾನ್ಫ್ಲುಯೆನ್ಸ್" ಸ್ಟ್ರಾಟಜಿ (ಟ್ರೆಂಡ್ ಫಾಲೋಯಿಂಗ್ / Trend Following)
• ಲಾಂಗ್ ಎಂಟ್ರಿ (Long Entry): ಮ್ಯಾಕ್ರೋ ಕ್ಲೌಡ್ ಬುಲ್ಲಿಶ್ (ಹಸಿರು) ಆಗುವವರೆಗೆ ಕಾಯಿರಿ. ಮೈಕ್ರೋ ಕ್ಲೌಡ್ ಪುಲ್ಬ್ಯಾಕ್ (pullback) ಆಗಿ, ಮ್ಯಾಕ್ರೋ ಟ್ರೆಂಡ್ನ ದಿಕ್ಕಿನಲ್ಲಿಯೇ ಹೊಸ ಬುಲ್ಲಿಶ್ ಕ್ರಾಸ್ಓವರ್ ಅನ್ನು ಪ್ರಿಂಟ್ ಮಾಡಿದಾಗ ಎಂಟ್ರಿ ತೆಗೆದುಕೊಳ್ಳಿ.
• ಶಾರ್ಟ್ ಎಂಟ್ರಿ (Short Entry): ಮ್ಯಾಕ್ರೋ ಕ್ಲೌಡ್ ಬೇರಿಶ್ (ಕೆಂಪು) ಆಗುವವರೆಗೆ ಕಾಯಿರಿ. ಮೈಕ್ರೋ ಕ್ಲೌಡ್ ರ್ಯಾಲಿ (rally) ಆಗಿ, ಮ್ಯಾಕ್ರೋ ಟ್ರೆಂಡ್ಗೆ ಸಿಂಕ್ ಆಗಿ ಹೊಸ ಬೇರಿಶ್ ಕ್ರಾಸ್ಓವರ್ ಅನ್ನು ಪ್ರಿಂಟ್ ಮಾಡಿದಾಗ ಎಂಟ್ರಿ ತೆಗೆದುಕೊಳ್ಳಿ.
2. "ಮೊಮೆಂಟಮ್ ಸ್ನೈಪರ್" ಸ್ಟ್ರಾಟಜಿ (ಬ್ರೇಕ್ಔಟ್ಗಳು / Breakouts)
• ಸ್ಮಾರ್ಟ್ ಡ್ಯಾಶ್ಬೋರ್ಡ್ ಅನ್ನು ಗಮನಿಸಿ. ಮಾರ್ಕೆಟ್ ರೇಂಜಿಂಗ್ (ranging) ನಿಂದ "ಸ್ಟ್ರಾಂಗ್ ಬುಲ್ಲಿಶ್" (85%+ ಮೊಮೆಂಟಮ್) ಅಥವಾ "ಸ್ಟ್ರಾಂಗ್ ಬೇರಿಶ್" ಗೆ ಬದಲಾದಾಗ, ಇತರರು ರಿಯಾಕ್ಟ್ ಮಾಡುವ ಮುನ್ನವೇ ಬ್ರೇಕ್ಔಟ್ ಟ್ರೇಡ್ಗಳಲ್ಲಿ ಎಂಟ್ರಿ ತೆಗೆದುಕೊಳ್ಳಲು ಇದನ್ನು ಟ್ರಿಗರ್ ಆಗಿ ಬಳಸಿ.
3. ಎಕ್ಸಾಶನ್ ಮತ್ತು ಎಕ್ಸಿಟ್ಗಳು (Exhaustion & Exits)
• ಮೈಕ್ರೋ SMI ಎಕ್ಸ್ಟ್ರೀಮ್ ಟಿಂಟೆಡ್ ಝೋನ್ಗಳಿಗೆ (+80 ಅಥವಾ -80) ತಲುಪಿದಾಗ ಮತ್ತು ಡೈವರ್ಜೆನ್ಸ್ ಲೇಬಲ್ (Divergence label) ಅನ್ನು ಪ್ರಿಂಟ್ ಮಾಡಿದಾಗ, ಪ್ರಾಫಿಟ್ ಬುಕ್ ಮಾಡಲು ಅಥವಾ ನಿಮ್ಮ ಟ್ರೈಲಿಂಗ್ ಸ್ಟಾಪ್-ಲಾಸ್ (trailing stop losses) ಅನ್ನು ಟೈಟ್ ಮಾಡಲು ಪ್ಲಾನ್ ಮಾಡಿ.
🔔 ಬಿಲ್ಟ್-ಇನ್ ಪ್ರೊ ಅಲರ್ಟ್ಗಳು (Built-In Pro Alerts)
GCM SSCO ಹೈ-ಪ್ರಾಬಬಿಲಿಟಿ ಅಲರ್ಟ್ ಕಂಡೀಷನ್ಗಳೊಂದಿಗೆ ಸಂಪೂರ್ಣವಾಗಿ ಲೋಡ್ ಆಗಿದೆ:
• 🔥 ಸ್ಟ್ರಾಂಗ್ ಬುಲ್ಲಿಶ್ / 🩸 ಸ್ಟ್ರಾಂಗ್ ಬೇರಿಶ್ ಮೊಮೆಂಟಮ್: 9-ಪಾಯಿಂಟ್ ಎಂಜಿನ್ ಬಲವಾದ ಕಾನ್ಫ್ಲುಯೆನ್ಸ್ ಅನ್ನು (8+ ಇಂಡಿಕೇಟರ್ಗಳು ಸಿಂಕ್ ಆದಾಗ) ಪತ್ತೆಹಚ್ಚಿದಾಗ ಮಾತ್ರ ನಿಖರವಾಗಿ ಫೈರ್ ಆಗುತ್ತದೆ.
• 🟢 ಕ್ಲೌಡ್ ಕಾನ್ಫ್ಲುಯೆನ್ಸ್ (ಬುಲ್ಲಿಶ್/ಬೇರಿಶ್): ಮೈಕ್ರೋ ಮತ್ತು ಮ್ಯಾಕ್ರೋ ಕ್ಲೌಡ್ಗಳೆರಡೂ ಒಂದೇ ದಿಕ್ಕಿನಲ್ಲಿ ಸಿಂಕ್ರೊನೈಸ್ ಆದ ತಕ್ಷಣ ಫೈರ್ ಆಗುತ್ತದೆ, ಇದು ಮಾರ್ಕೆಟ್ ದಿಕ್ಕಿನ ಏಕೀಕೃತ ಬದಲಾವಣೆಯನ್ನು ಸೂಚಿಸುತ್ತದೆ.
⚠️ ಹಕ್ಕುತ್ಯಾಗ ಮತ್ತು ಅಪಾಯದ ಎಚ್ಚರಿಕೆ (Disclaimer & Risk Warning):
GCM ಸ್ಮಾರ್ಟ್ SMI ಕ್ಲೌಡ್ ಆಸಿಲೇಟರ್ (SSCO) ಕೇವಲ ಶೈಕ್ಷಣಿಕ ಮತ್ತು ಮಾಹಿತಿ ಉದ್ದೇಶಗಳಿಗಾಗಿ ಒದಗಿಸಲಾದ ವಿಶ್ಲೇಷಣಾತ್ಮಕ ಸಾಧನವಾಗಿದೆ. ಇದು ಆರ್ಥಿಕ ಅಥವಾ ಹೂಡಿಕೆ ಸಲಹೆಯಲ್ಲ. ಹಣಕಾಸು ಮಾರುಕಟ್ಟೆಗಳಲ್ಲಿ (ಕ್ರಿಪ್ಟೋ, ಫಾರೆಕ್ಸ್, ಸ್ಟಾಕ್ಸ್, ಆಪ್ಷನ್ಸ್) ಟ್ರೇಡಿಂಗ್ ಮಾಡುವುದು ಹೆಚ್ಚಿನ ಮಟ್ಟದ ಅಪಾಯವನ್ನು ಒಳಗೊಂಡಿರುತ್ತದೆ ಮತ್ತು ಇದು ಎಲ್ಲಾ ಹೂಡಿಕೆದಾರರಿಗೆ ಸೂಕ್ತವಲ್ಲ. ಯಾವುದೇ ಇಂಡಿಕೇಟರ್ ಅಥವಾ ಟ್ರೇಡಿಂಗ್ ಸಿಸ್ಟಮ್ನ ಹಿಂದಿನ ಕಾರ್ಯಕ್ಷಮತೆಯು ಭವಿಷ್ಯದ ಫಲಿತಾಂಶಗಳ ಸೂಚಕವಲ್ಲ. ಯಾವಾಗಲೂ ನಿಮ್ಮದೇ ಆದ ರಿಸರ್ಚ್ (due diligence) ಮಾಡಿ, ಯಾವುದೇ ಸ್ಟ್ರಾಟಜಿಯನ್ನು ಕಟ್ಟುನಿಟ್ಟಾಗಿ ಬ್ಯಾಕ್ಟೆಸ್ಟ್ ಮಾಡಿ ಮತ್ತು ಕಟ್ಟುನಿಟ್ಟಾದ ರಿಸ್ಕ್ ಮ್ಯಾನೇಜ್ಮೆಂಟ್ ಅನ್ನು ಅನುಸರಿಸಿ. ಈ ಸ್ಕ್ರಿಪ್ಟ್ ಅನ್ನು ಬಳಸುವಾಗ ಉಂಟಾಗುವ ಯಾವುದೇ ಆರ್ಥಿಕ ನಷ್ಟಗಳಿಗೆ ಲೇಖಕರು ಯಾವುದೇ ಜವಾಬ್ದಾರಿ ಅಥವಾ ಹೊಣೆಗಾರಿಕೆಯನ್ನು ವಹಿಸುವುದಿಲ್ಲ.
HAPPY TRADING
指標

Trend Intelligence System
What This Indicator Does
The Trend Intelligence System transforms a traditional multi-MA ribbon into an analytical framework that quantifies trend strength across multiple timeframe layers. Rather than simply displaying Moving Averages and leaving interpretation to visual analysis, this system calculates objective metrics that answer key questions: How aligned is the trend across all timeframes? Where is price relative to the MA structure? Are the MAs compressing (signaling potential breakout)? Where do multiple MAs cluster to form significant levels?
The indicator displays up to eight independently configurable Moving Averages, each capable of pulling data from different timeframes and using different calculation methods. Beyond visualization, it provides a Trend Alignment Score that quantifies momentum direction, a Price Position Score that measures where price sits within the MA structure, and real-time detection of compression and confluence conditions.
How It Works
1. Multi-Layer Moving Average System
Eight Moving Averages are available, each with independent configuration for Length, Type (SMA, EMA, RMA, WMA, HMA, VWMA), and Timeframe. The default configuration spans from 8 EMA (fast momentum) to 800 EMA (secular trend), providing complete trend context from scalping to position trading perspectives. Each MA can reference a different timeframe, enabling multi-timeframe analysis on a single chart without switching.
2. Trend Alignment Score Calculation
The system calculates slope direction for each enabled MA by comparing current value to the previous bar's value. The Trend Score formula is:
Trend Score = ((Bullish MAs - Bearish MAs) / Total Enabled MAs) × 100
This produces a score from -100 (all MAs falling) to +100 (all MAs rising). Scores above +50 indicate strong bullish alignment; below -50 indicates strong bearish alignment. The score crossing zero signals momentum transition.
3. Price Position Analysis
The indicator counts how many MAs price is currently above versus below:
Position Score = (MAs Price is Above / Total Enabled MAs) × 100
A score of 100% means price is above all MAs (fully bullish positioning); 0% means price is below all MAs (fully bearish positioning). This metric helps identify overextension and potential mean reversion setups.
4. Compression Detection
Compression occurs when all MAs converge to similar price levels, often preceding significant breakouts. The system measures:
Spread % = ((Highest MA - Lowest MA) / Current Price) × 100
When Spread % falls below the user-defined threshold (default 1.0%), compression is detected and the background highlights. Traders use compression as a setup indicator, preparing for directional breakouts when the MAs begin expanding.
5. Confluence Detection
The system identifies price levels where multiple MAs cluster together. These zones often act as powerful support/resistance because they represent agreement across multiple timeframes. The algorithm calculates median MA value and counts how many MAs fall within the threshold percentage, flagging confluence when the minimum MA count is reached.
6. Dynamic Slope Coloring (Disabled by Default)
When enabled, each MA line changes color based on its direction: rising MAs show bullish color, falling MAs show bearish color. This transforms the ribbon from a static display into a dynamic momentum map.
7. Dynamic Zone Coloring (Disabled by Default)
When enabled, the filled zones between MAs change color based on both boundary MAs. Both rising shows bullish color, both falling shows bearish color, and mixed directions show neutral color. This immediately visualizes where trend agreement exists versus where conflict occurs.
8. Crossover Detection (Disabled by Default)
The system monitors for Golden Cross (50-period MA crosses above 200-period MA), Death Cross (opposite), and general crossovers where any faster MA crosses any slower MA.
How to Use This Indicator
For Trend Identification: Monitor the Trend Score on the dashboard. Scores above +50 suggest trading with bullish bias; scores below -50 suggest bearish bias. The "FULL BULL" or "FULL BEAR" alignment status indicates strongest trend conditions.
For Breakout Trading: Enable Compression Detection. When "COMPRESSED" appears and background highlights, prepare for a breakout. Enter in the direction of the subsequent expansion.
For Support/Resistance Analysis: Enable Confluence Detection. When multiple MAs cluster, these levels often provide strong reaction points. The confluence zone is highlighted on the chart.
For Multi-Timeframe Analysis: Configure different MAs to pull from different timeframes. Set MA7 and MA8 to use the Daily timeframe while on a 1-hour chart for higher timeframe context.
For Momentum Shifts: Enable MA Crossovers. Small circles mark momentum shifts when faster MAs cross slower ones.
Dashboard Interpretation
The dashboard provides at-a-glance analysis showing Trend Score (quantified alignment from -100 to +100), Bullish MAs count, Price Above count, Position Score, MA Spread status (Compressed or Normal), Spread percentage, Confluence status, Trend Bias (Bullish/Bearish/Neutral), and Alignment state (Full Bull/Full Bear/Mixed).
What Makes This Original
While multi-MA ribbons exist, this implementation adds analytical depth through quantified Trend Scoring that transforms subjective visual interpretation into objective measurement, Compression Detection with configurable thresholds that identifies potential breakout setups algorithmically, Confluence Zone Detection that automatically finds where multiple timeframes agree on significant levels, Dynamic Coloring System for real-time slope and zone coloring based on momentum direction, Price Position Scoring that measures where price sits within the entire MA structure, and a comprehensive Alert System with 14 distinct alert conditions for automated monitoring. The combination of visualization and quantification transforms this from a display tool into an analytical framework.
Non-Repainting Behavior
When "Wait for Bar Close" is enabled, all calculations use confirmed bar data only. Signals, scores, and visual elements update only after bars close, ensuring what you see historically is what you would have seen in real-time.
Available Alerts
The indicator includes alerts for Strong Bullish/Bearish Trend (75%+ alignment), Trend Score Zero Crosses (momentum transitions), Price Above/Below All MAs, Compression Detection and Breakout, MA Confluence Zones, Golden Cross and Death Cross, General MA Crossovers, and Full Bullish/Bearish Alignment achieved.
Recommended Settings by Trading Style
Day Trading (5-15 minute charts): MAs 1-4 enabled with lengths 8, 16, 30, 50. Enable Compression Detection with 0.5% threshold.
Swing Trading (1-4 hour charts): All MAs enabled with default lengths. Enable Confluence Detection. Use MA7 and MA8 from Daily timeframe.
Position Trading (Daily charts): Focus on MAs 4-8 (50 to 800). Enable Golden/Death Cross signals.
Scalping (1-3 minute charts): MAs 1-3 only with lengths 5, 10, 20. Enable Dynamic Slope Coloring.
Disclaimer
This indicator is a technical analysis tool designed to assist with trend identification and analysis. It does not predict future price movements and should not be used as the sole basis for trading decisions. Always use proper risk management and consider multiple factors when making trading decisions. This indicator is suitable for all markets including stocks, forex, cryptocurrencies, and futures across all timeframes.
指標
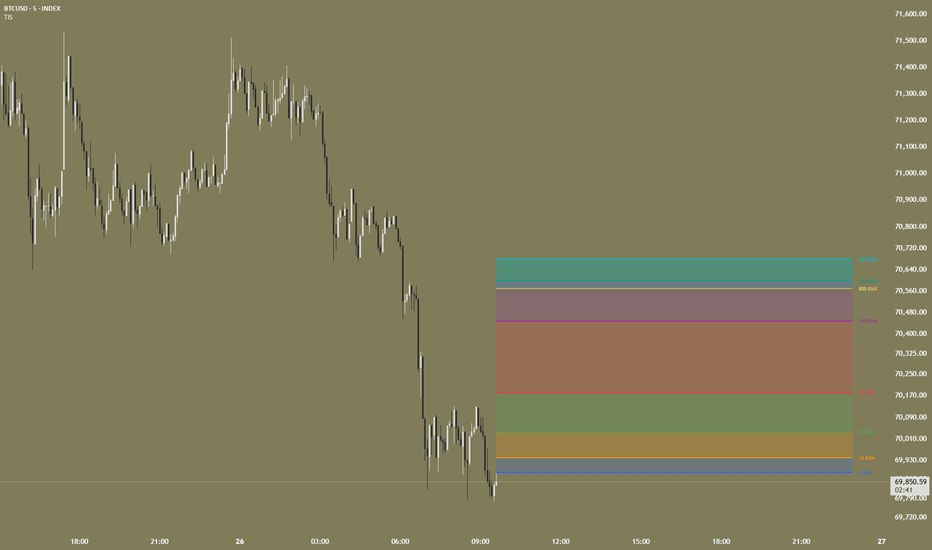
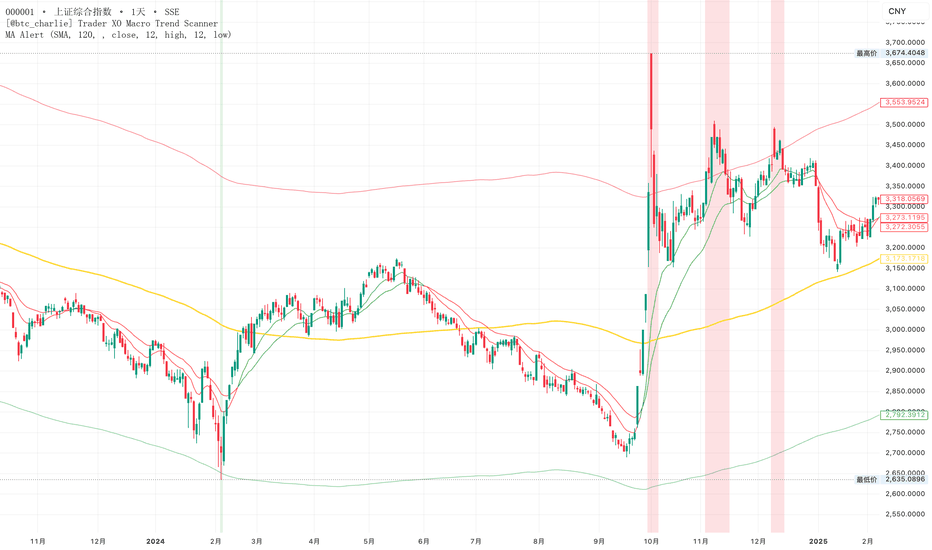
MA Distance Alert# MA Distance Alert - 均线偏离警报指标
## 中文说明
### 指标简介
MA Distance Alert 是一款基于均线原理的价格偏离监控指标,支持SMA/EMA双均线类型,可自定义均线周期与价格偏离阈值,实时监控价格与均线的偏离程度,当价格超出设定的偏离区间时自动触发视觉提醒与警报通知,辅助交易者快速捕捉价格极端偏离、趋势反转或加速行情信号。
### 核心功能
1. **灵活均线配置**:支持SMA(简单移动平均)、EMA(指数移动平均)两种常用均线类型,可自由调整均线计算周期
2. **精准偏离监控**:自动计算收盘价与均线的偏离百分比,基于自定义阈值生成上下偏离轨道
3. **多重视觉提醒**:高亮标注超出偏离区间的K线背景,上偏离显示红色背景,下偏离显示绿色背景
4. **智能警报通知**:支持价格向上突破、向下跌破、双向偏离三种警报条件,覆盖全场景监控需求
5. **界面友好**:指标叠加在主图显示,不遮挡价格走势,线条配色清晰易辨
### 使用方法
1. 将指标代码添加至TradingView Pine编辑器,加载至图表
2. 参数自定义:选择均线类型、设置均线周期(默认120)、调整偏离阈值(默认12%)
3. 实时观察:价格在上下轨道内运行为正常区间,超出轨道时触发背景高亮
4. 警报设置:开启指标警报,接收价格极端偏离的实时通知
### 适用场景
适用于股票、加密货币、外汇、期货等全品类交易品种,可用于趋势行情中的回调预警、震荡行情中的高低点捕捉、极端行情中的超买超卖判断,适配日线、小时线等所有时间周期。
---
# MA Distance Alert - Moving Average Distance Alert Indicator
## English Description
### Indicator Introduction
MA Distance Alert is a price deviation monitoring indicator based on the moving average principle. It supports both SMA and EMA types, allowing custom moving average periods and price deviation thresholds. It monitors the deviation between price and moving average in real time, automatically triggers visual reminders and alert notifications when the price exceeds the set deviation range, helping traders quickly capture signals of extreme price deviation, trend reversal or accelerated market trends.
### Core Features
1. **Flexible MA Configuration**: Support two commonly used moving average types: SMA (Simple Moving Average) and EMA (Exponential Moving Average), freely adjust the MA calculation period
2. **Accurate Deviation Monitoring**: Automatically calculate the deviation percentage between the closing price and the moving average, generate upper and lower deviation bands based on custom thresholds
3. **Multiple Visual Alerts**: Highlight the K-line background when exceeding the deviation range, red background for upward deviation and green background for downward deviation
4. **Smart Alert Notifications**: Support three alert conditions: price breakout upward, breakdown downward, and two-way deviation, covering full-scenario monitoring needs
5. **User-friendly Interface**: Overlaid on the main chart without blocking price movements, with clear and distinguishable line colors
### How to Use
1. Add the indicator code to TradingView Pine Editor and load it on the chart
2. Customize Parameters: Select MA type, set MA period (default 120), adjust deviation threshold (default 12%)
3. Real-time Observation: Price moving within upper and lower bands is the normal range, background highlight is triggered when exceeding the bands
4. Alert Setup: Enable indicator alerts to receive real-time notifications of extreme price deviations
### Applicable Scenarios
Suitable for all trading varieties including stocks, cryptocurrencies, forex, futures, etc. It can be used for callback early warning in trending markets, high-low point capture in ranging markets, overbought and oversold judgment in extreme markets, compatible with all time frames such as daily and hourly charts.
指標
EMA Cluster Absorption Engine [KNN Engine]EMA Cluster Absorption Engine
1. What the Script Does
The EMA Cluster Absorption Engine is a high-sensitivity momentum and consensus oscillator designed to identify sharp, momentum-driven reversals (often referred to as "V-Bottoms" or "V-Tops"). It moves beyond standard moving averages by evaluating price action across 24 simultaneous Exponential Moving Average (EMA) time-horizons.
Furthermore, it introduces a built-in K-Nearest Neighbors (KNN) Machine Learning Algorithm to calculate the statistical probability of a mean-reversion bounce based on historical market data.
Rather than relying on a single, arbitrary EMA length, this indicator mathematically aggregates 24 distinct momentum cycles to verify if the entire institutional ecosystem is overextended. It visualizes this data through a dynamically scaling histogram, a multi-ribbon fan, and volatility boundaries.
2. The Core Innovation: How it Calculates Everything
Standard moving averages rely on fixed lookback periods (e.g., a 50-EMA), which inherently lag the market and drop relevant historical data. This script is fundamentally original because it abandons fixed lookbacks in favor of Anomaly Anchoring, Expanding EMA Recursion, and Predictive Classification.
Anomaly Anchoring: The engine constantly scans volume for statistical deviations. When it detects a volume spike exceeding a 2.5 Z-Score, it drops a mathematical "Anchor." It tracks the last 24 of these institutional liquidity events simultaneously.
Expanding EMA Recursion: From each of the 24 anchor points, the script begins calculating an independent EMA. Unlike fixed EMAs, these use an "Expanding Alpha" ($\alpha = 2 / (count + 1)$), making them incredibly sensitive to the initial impulse of a new trend while maintaining the memory of the anchor point.
The Consensus Meta-Mean: The script calculates the absolute average of all 24 active EMA lines. This "Meta-EMA" represents the true equilibrium of the market's current momentum. The distance of price from this average is converted into a Z-Score, standardizing the deviation across any asset class.
The K-Nearest Neighbors (KNN) Engine: When the script detects 100% Consensus (e.g., all 24 active EMAs are simultaneously above or below price), it captures the exact numerical fingerprint of the market (EMA Deviation, EMA Velocity, and Price Velocity). The KNN engine calculates the Euclidean Distance between the current fingerprint and the last 300 historical fingerprints. It finds the 5 nearest neighbors (the 5 times history looked mathematically identical) and checks their win/loss results to generate a live probability score.
3. Justifying the Methodology
Why combine 24 expanding EMAs with a KNN machine learning model? Because fast-moving markets frequently outrun standard indicators.
In high-volatility environments, traditional simple moving averages (SMAs) lag too much to catch the absolute bottom or top. EMAs hug price closer, making them the preferred benchmark for momentum algorithms. By anchoring 24 separate EMAs to actual volume anomalies, we verify if the entire market ecosystem—even the most sensitive momentum metrics—agrees on the overextension. By passing that data through a KNN algorithm, we filter out low-quality traps by asking the data: "The last 5 times momentum snapped this aggressively, did price successfully reverse by at least 0.1%?"
4. How to Use the Indicator
Visual Layout:
The Structural Fan (Ribbons): 24 individual EMA lines plotted on a standardized Z-axis. When tightly compressed, momentum is structurally unanimous. When fanned out, momentum is decaying or conflicted.
The Engine Histogram: Visualizes the standardized deviation of price from the Meta-EMA.
Expansion (Bright): Bright Blue or Bright Lime/Red bars indicate that momentum is actively accelerating away from equilibrium.
Contraction (Dark): Dark, highly transparent bars indicate that momentum is decaying or cooling off back toward the zero-line.
Tactical Trade Execution:
Spot the Momentum Purge: Watch the histogram expand into extreme territory (Lime for bullish potential, Red for bearish potential). Because this is an EMA engine, this happens when price moves faster than the institutional momentum "gas" can follow. Do not enter yet.
Wait for the Machine Learning Confirmation: Wait for the background to flash Lime (Bullish) or Red (Bearish) with a printed percentage (e.g., 80%). This means the KNN algorithm has verified that identical historical momentum snaps successfully reversed price.
The Trigger: Wait for the white Signal Line to peak (often printing an Exhaustion ✧ marker) and begin receding back toward the zero-line, ultimately "re-enveloping" the histogram bars. This confirms that the extreme directional friction has officially snapped, signaling a high-probability mean reversion. 指標

指標