指標

指標

指標

指標

策略

指標
指標

指標

指標

MTF EMA Trend Table (50/100/200)Using the MTF EMA Trend Table for Supply & Demand Trading
This document explains how to use the Multi‑Timeframe EMA Trend Table as part of a supply and demand trading strategy.
The indicator displays the trend direction (Bullish or Bearish) for EMA 50, 100, and 200 across the following timeframes: 5m, 15m, 30m, 1h, 4h, 1d, and 1w.
---------------------------------------------
1. What the Indicator Shows
---------------------------------------------
The EMA Trend Table instantly reveals whether price is trading above or below the EMA 50/100/200 on multiple timeframes.
• Price above EMA = Bullish trend
• Price below EMA = Bearish trend
This allows you to identify trend alignment across all key timeframes.
---------------------------------------------
2. Why EMAs Matter in Supply & Demand Trading
---------------------------------------------
Supply & Demand zones show where institutions previously bought or sold aggressively. To trade these zones effectively, you must confirm higher‑timeframe trend direction.
The EMA table prevents low‑probability trades by keeping you aligned with institutional flow.
---------------------------------------------
3. How to Use the Indicator for Supply & Demand Trading
---------------------------------------------
Step 1 — Identify Higher‑Timeframe Bias (4H, 1D, 1W)
• Bullish alignment (all green) → Trade demand zones only.
• Bearish alignment (all red) → Trade supply zones only.
Step 2 — Use 1H, 30M, 15M for Setup Timing
These mid‑timeframes help you determine when a pullback is nearing completion.
Step 3 — Trigger Entry on the 5M EMA Flip
Once price enters a supply or demand zone, wait for the 5m EMA trend to flip in your direction before entering.
---------------------------------------------
4. How to Judge Zone Strength Using EMAs
---------------------------------------------
Strong Demand Zone Characteristics:
• Price above EMA200 on 1H+
• Zone forms above EMA200
• Pullback touches EMA50 or EMA100
Strong Supply Zone Characteristics:
• Price below EMA200 on 1H+
• Zone forms below EMA200
• Pullback touches EMA50 or EMA100
---------------------------------------------
5. Full Trade Example
---------------------------------------------
Higher timeframes are bullish: 1W, 1D, 4H all green.
Price pulls back into a 15m demand zone.
5m flips from Bearish → Bullish.
This is the entry confirmation.
---------------------------------------------
6. Why This Indicator Improves Your Trading
---------------------------------------------
• Confirms trend direction
• Shows alignment across timeframes
• Helps avoid counter‑trend traps
• Improves zone accuracy and confidence
• Enhances timing using the 5m EMA flip
This combination is ideal for institutional‑style supply and demand trading.
指標

指標
指標
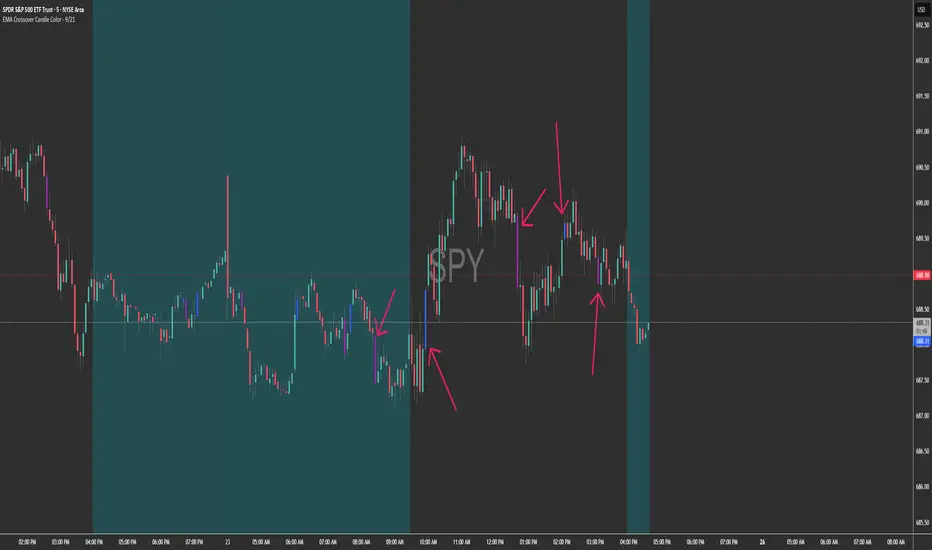
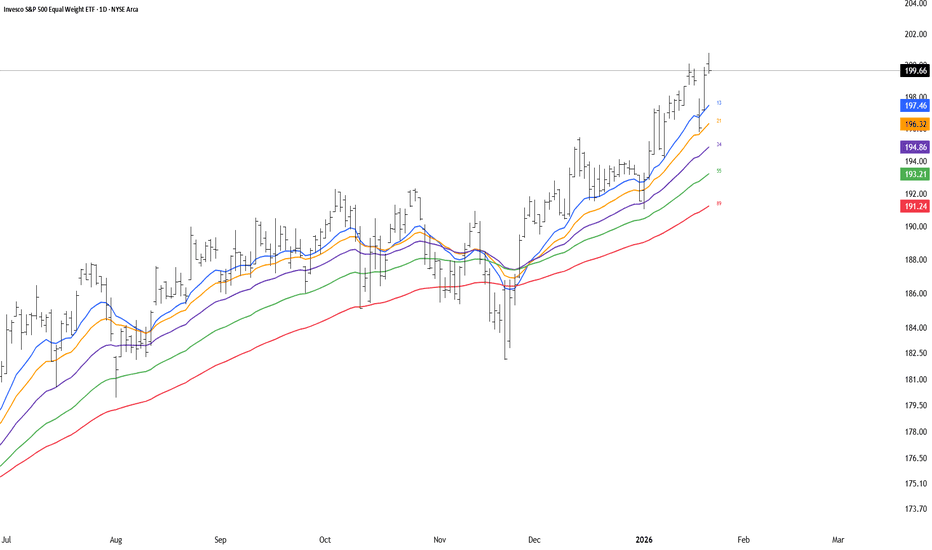
Ripster EMA Clouds with MTFCredits & Origins:
This script is a modification of the widely popular EMA Clouds system originally created by @Ripster47. Full credit goes to him for the strategy and original concept. This version simply adds a quality-of-life feature for traders who use multi-timeframe analysis.
What is this Indicator?
The Ripster EMA Clouds system uses overlapping Exponential Moving Averages (EMAs) to visualize trends, momentum, and dynamic support/resistance zones. The "clouds" differ in color to indicate bullish or bearish trends, acting as a visual guide for keeping you on the right side of the trade.
What is New in This Version? (MTF Capability)
The standard version of this indicator calculates EMAs based on your current chart timeframe. If you switch from a 10-minute chart to a 1-minute chart, the clouds change completely.
I have added a "Fixed Timeframe" variable/input that allows you to "lock" the clouds to a specific timeframe, regardless of what chart you are viewing.
Why is this useful? This allows for true Multi-Timeframe (MTF) scalping.
Example: You can set the clouds to look at the 10-minute trend (identifying major support levels) but execute your entries on a 1-minute chart.
The clouds will remain locked to the 10-minute data, giving you the "big picture" view while you trade the micro-movements.
How to Use
Open the indicator settings.
Go to the Inputs tab.
Find the "Fixed Timeframe" option at the top.
Leave Empty (Default): The indicator behaves exactly like the original (adjusts to your chart).
Select a Timeframe (e.g., 10 Minutes): The clouds will lock to the 10-minute EMAs, even if you switch your chart to 1-minute or 5-seconds.
Note on Visuals When viewing Higher Timeframe (HTF) clouds on a Lower Timeframe (LTF) chart, the clouds will appear to have a "stepped" or "ladder-like" appearance. This is normal and accurate. It represents the single EMA value holding constant for that entire higher-timeframe period. This helps you see the true support level rather than a smoothed, repainted line. 指標

指標

VIX Crossing# VIX Crossing Strategy
## Overview
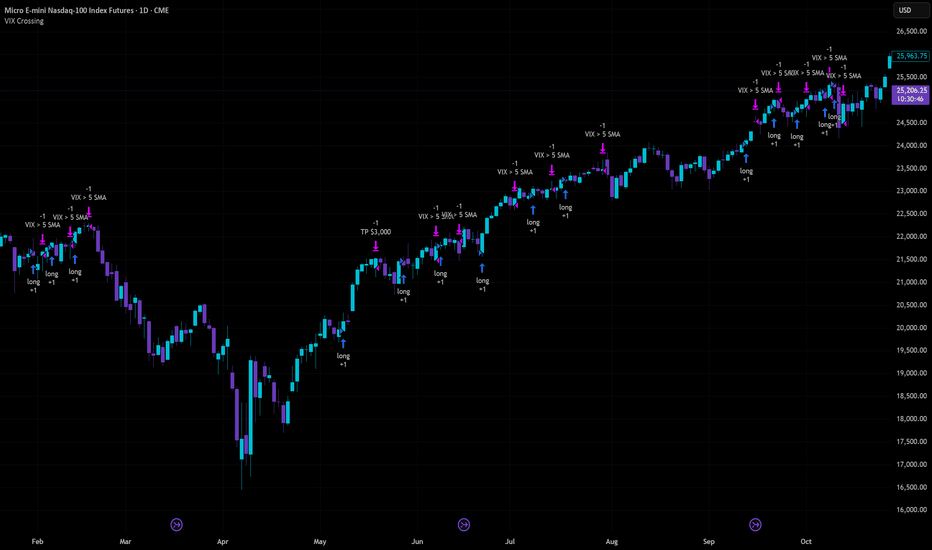
VIX Crossing is a quantitative trading strategy that combines volatility signals from the VIX index with trend confirmation from the Nasdaq-100 (NDX) to generate long entry signals. The strategy employs multiple exit conditions to manage risk and lock in profits systematically.
## Strategy Logic
### Entry Condition
The strategy initiates a long position when:
- **VIX Crossunder**: The VIX closing price crosses below its 5-bar simple moving average (SMA), signaling a decrease in implied volatility
- **AND NDX Confirmation**: The Nasdaq-100 closes above its 21-bar exponential moving average (EMA), confirming uptrend strength
This dual-signal approach reduces false entries by requiring both volatility normalization and positive market momentum.
### Exit Conditions
The strategy automatically closes positions when any of the following conditions are met:
1. **VIX Crossover (Volatility Exit)**: VIX closes above its SMA, indicating rising volatility
2. **Time-Based Exit**: Position is force-closed after 10 bars from entry, preventing prolonged drawdowns
3. **Take-Profit Exit**: Position closes when unrealized profit exceeds $3,000 per contract
4. **Stop-Loss Exit**: Position closes when unrealized loss exceeds $1,500 per contract
Exit conditions are evaluated each bar while the position is open, with explicit logging of the exit reason for trade analysis.
## Configuration Parameters
| Parameter | Default | Purpose |
|-----------|---------|---------|
| VIX SMA Length | 5 | Smoothing period for VIX volatility baseline |
| NDX EMA Length | 21 | Smoothing period for Nasdaq-100 trend confirmation |
| Force Close After X Bars | 10 | Maximum holding period in bars |
| TP Amount per Contract | $3,000 | Profit target per contract |
| SL Amount per Contract | $1,500 | Loss limit per contract |
## Risk Management Features
- **Position Sizing**: Capital allocation based on profit/loss per contract rather than fixed units, allowing for scalable risk
- **Dual Risk Controls**: Combined time-based and price-based exits prevent extended exposure
- **Profit Asymmetry**: 2:1 profit-to-loss ratio encourages risk/reward discipline
- **Contract-Based Accounting**: Profit targets and stop losses scale with position size
## Capital Requirements
- **Initial Capital**: $50,000
- **Commission**: $3 per contract (cash-based)
- **Instrument**: Designed for index-based derivatives or equities with liquid options markets
## Technical Indicators Used
- Simple Moving Average (SMA) for VIX smoothing
- Exponential Moving Average (EMA) for NDX trend detection
- Crossover/Crossunder detection for signal generation
## Underlying Assumptions
1. VIX crossunder events represent mean-reversion opportunities in Nasdaq-heavy portfolios
2. NDX EMA confirmation filters out uncorrelated volatility spikes
3. 10-bar holding period aligns with typical mean-reversion timeframes
4. Contract-based profit targets accommodate varying leverage levels
策略
指標
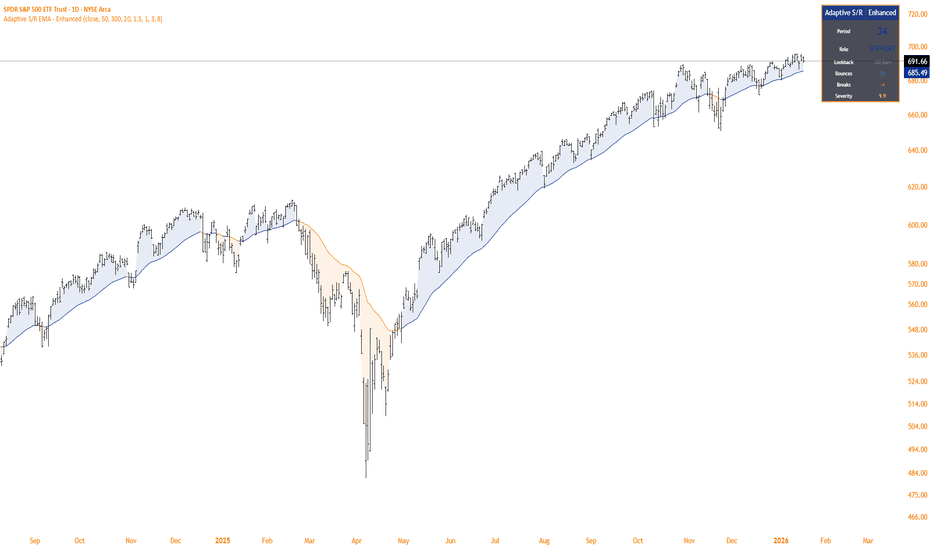
Adaptive Support/Resistance EMA IndicatorThis indicator automatically identifies and displays the optimal Exponential Moving Average (EMA) period for the current market conditions by analyzing how well different EMAs act as support or resistance levels.
How It Works
Adaptive Period Selection:
The indicator tests 33 different EMA periods (ranging from 5 to 400, including Fibonacci numbers like 8, 13, 21, 34, 55, 89, 144, 233, 377) and scores each based on how effectively it functions as support or resistance.
Intelligent Scoring System:
Each EMA is evaluated using three key metrics:
Respect Rate - Percentage of time price stays on the correct side of the EMA (above for support, below for resistance)
Successful Bounces - Number of times price approached the EMA and reversed without breaking through
Break Severity - Penalties for failed breaks, weighted by both depth and duration of the violation
Trend-Aware Behavior:
Uptrend (price > 50 EMA): Finds the EMA that best acts as a support floor below price
Downtrend (price < 50 EMA): Finds the EMA that best acts as a resistance ceiling above price
Adaptive Features:
Dynamic Lookback: Automatically adjusts analysis period (50-200 bars) based on market volatility
Sticky Selection: Won't switch EMAs unless new choice shows significant improvement (8% threshold by default)
Update Frequency: Recalculates every 20 bars or immediately during high volatility periods
Visual Elements
EMA Display:
Green line = Support (in uptrends)
Red line = Resistance (in downtrends)
Optional glow effect for enhanced visibility
Optional fill between price and EMA
Labels:
Shows "SUP " or "RES " when the selected EMA changes
Markers appear only when there's a meaningful change
Info Table:
Displays real-time statistics:
Current EMA period
Role (Support or Resistance)
Adaptive lookback length
Number of successful bounces
Number of breaks
Break severity score (color-coded: green < 5, yellow 5-20, red > 20)
Key Advantages
No manual EMA period selection needed
Adapts to changing market conditions automatically
Considers both bounce quality and break severity
Reduces whipsaws through sticky selection logic
Provides transparency with detailed performance metrics
Settings
Performance Settings:
Min/Max Lookback: Range for adaptive analysis window
Update Frequency: How often to recalculate (higher = faster performance)
Sticky Threshold: Required improvement % to switch EMAs
Detection Settings:
Touch Threshold: How close price must get to count as a "touch"
Bounce Window: Bars to confirm a successful bounce vs break
Visual Settings:
Customizable support/resistance colors
Toggle glow and fill effects
Show/hide info table and change markers 指標
指標

指標

指標

指標
指標

VWMA Cross Buy SignalCore Components & Logic
1. The Entry Engine (VWMA + Filters)
The strategy triggers a long signal when a Volume Weighted Moving Average (VWMA) crossover occurs.
Unlike a standard Simple Moving Average, the VWMA gives more weight to bars with higher volume. This ensures the indicator responds faster to "Smart Money" moves and slower to low-volume noise.
It uses a secondary Trend Filter (defaulting to the 200 EMA). By only buying when the price is above this line, the indicator forces you to stay on the right side of the primary market trend.
It requires volume to be higher than its recent average (e.g., 1.1× or 10% higher). This prevents entries on weak, low-conviction price moves.
2. The Dynamic Exit System
You have two distinct ways to manage your risk and targets, toggleable in the settings:
ATR Based (Volatility Adjusted): It calculates the Average True Range (ATR) to determine how volatile the stock is. By setting your Stop Loss at 2.0×ATR, you avoid getting "shaken out" by normal daily price fluctuations. The Take Profit is set at 4.4×ATR to capture large trend extensions.
Fixed % (Static): A more rigid approach where you set a hard percentage target (e.g., 10% gain / 5% loss).
3. The Performance Analytics Table
The grey minimalist table in the bottom-right corner uses cumulative percentage-based math to show:
Realized RRR: The actual Reward-to-Risk ratio based on your closed trades.
Break-Even Win Rate: The minimum win rate you need to stay profitable with your current RRR. It uses the formula:
BE WR=1+RRR1
Current Win Rate: Highlighted in Green if you are beating the Break-Even rate, or Red if the strategy is currently losing money on that specific stock.
Max Drawdown %: The most important metric for risk. It shows the largest peak-to-trough decline in your equity curve, letting you know how much losing streak can hurt your equity.
Strategic Use Case
This indicator is optimized for Stock Screening. When you flip through your watchlist, the table updates instantly.
If you see a stock with a high Win Rate and a Max Drawdown under 10%, you have found a ticker where the VWMA crossover logic is highly compatible with that stock's specific volatility. If the Win Rate cell is Red, you know the strategy is "un-tuned" for that asset and needs adjustment.
指標