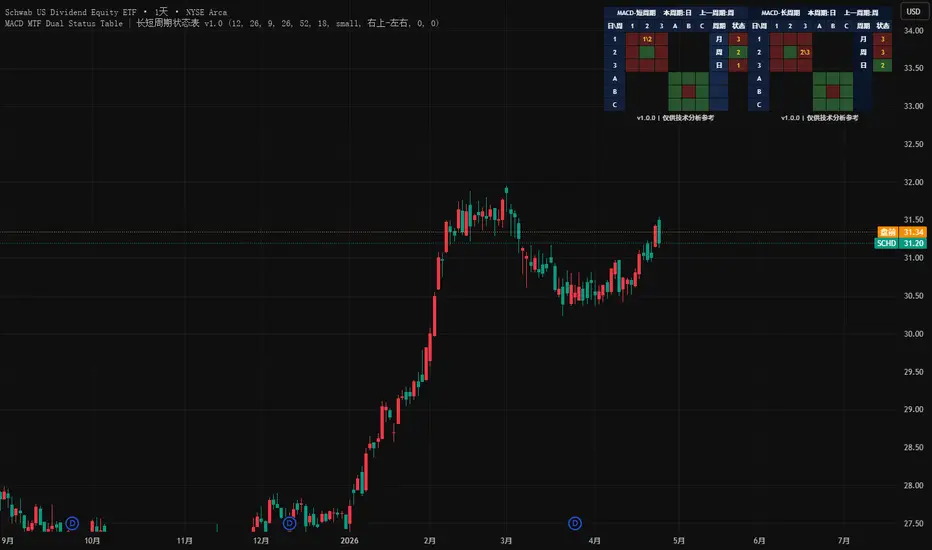
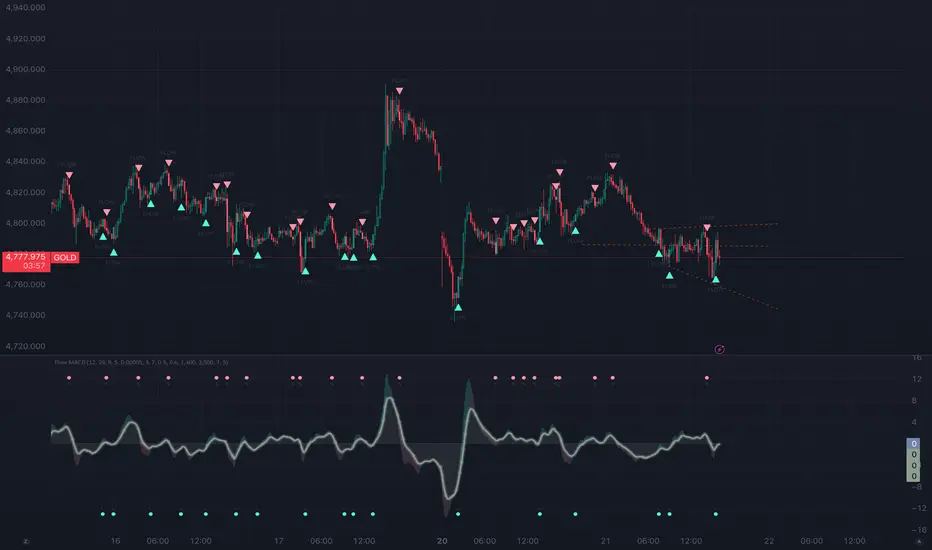
指標
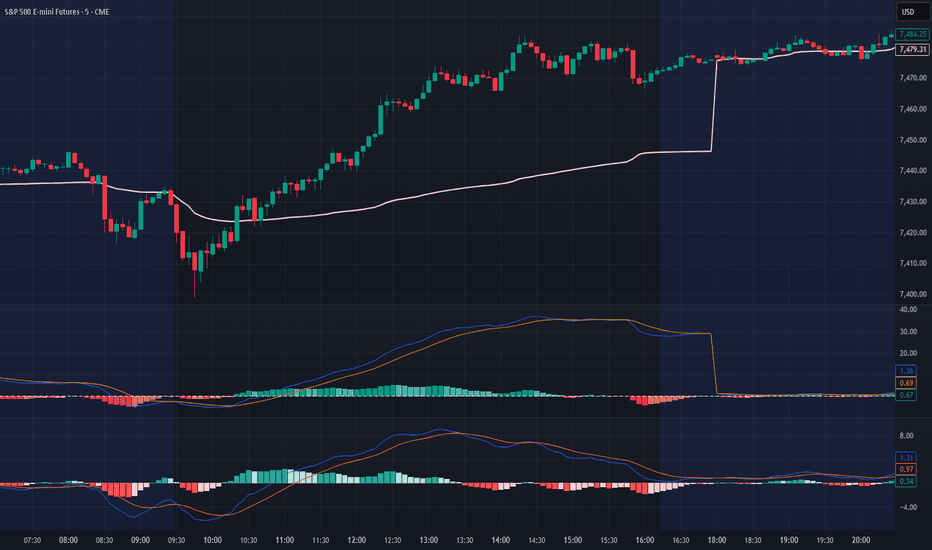
指標
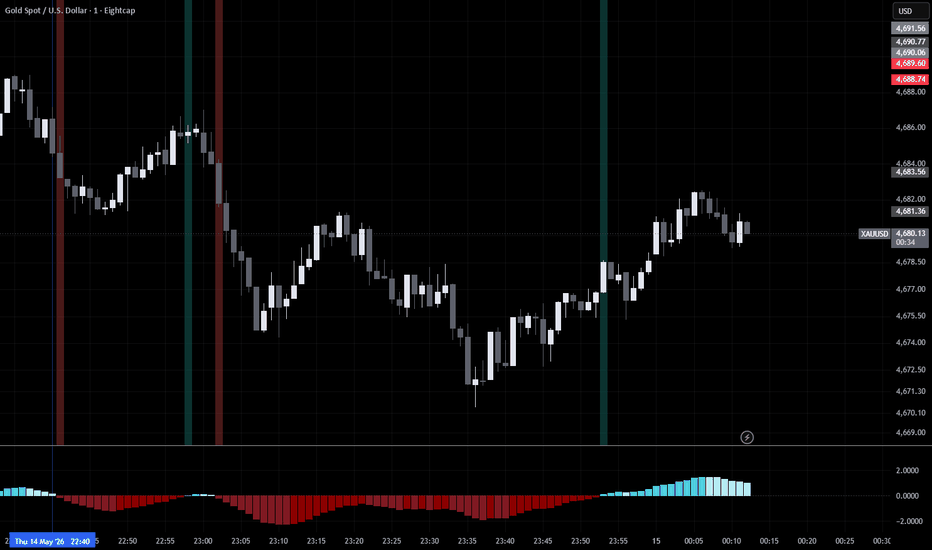
指標
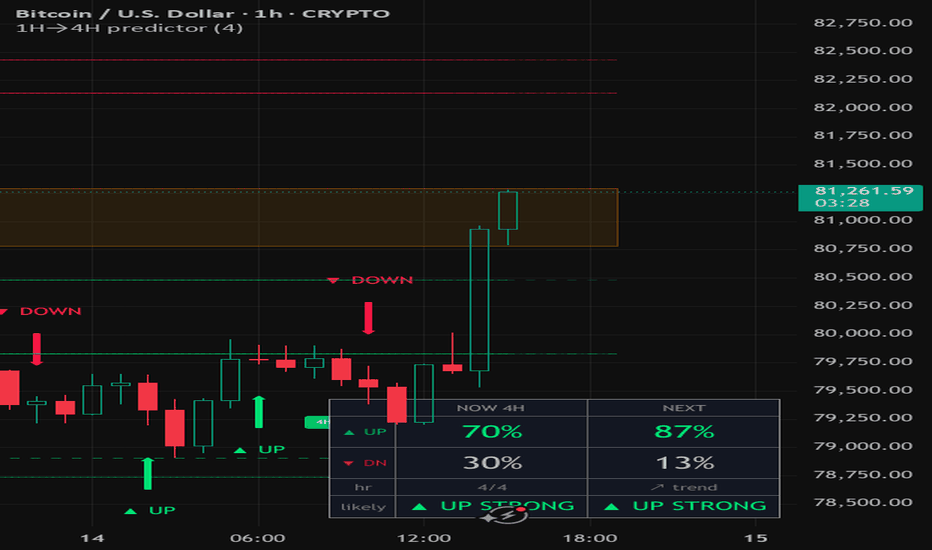
策略

策略

指標
指標
指標
指標
策略

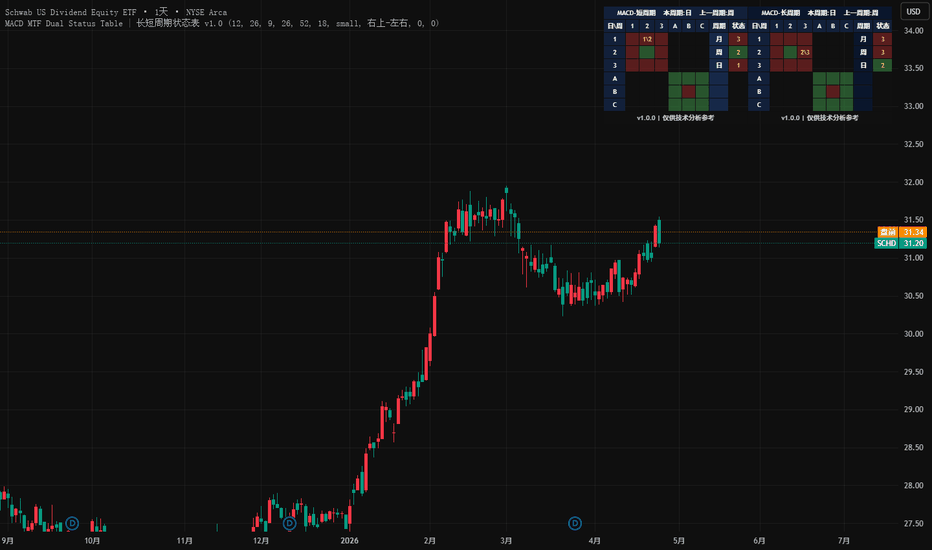
RSI & MACD MTF Station [v2c_cha]Overview
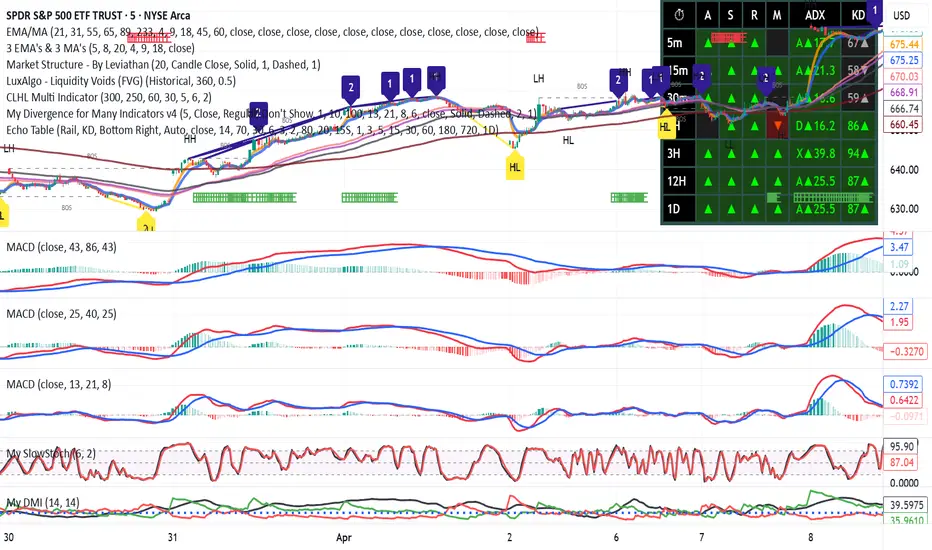
The RSI & MACD MTF Heatmap Station is a comprehensive, all-in-one momentum and trend analysis tool designed to eliminate chart clutter. Traditionally, traders relying on Multi-Timeframe (MTF) analysis must either split their screens into multiple layouts or flood their indicator panels with overlapping "spaghetti" lines. This indicator solves that problem by consolidating the Relative Strength Index (RSI) and Moving Average Convergence Divergence (MACD) across 9 different timeframes into a single, compact visual Heatmap.
Core Concepts & Calculations
This indicator relies on the standard mathematical formulas for RSI (default 14 periods) and MACD (default 12, 26, 9). However, its core value lies in how it processes and displays this data:
Non-Repainting MTF Data: All higher-timeframe data is fetched using barmerge.lookahead_off and barmerge.gaps_off to ensure strict compliance with non-repainting rules. What you see on historical bars is exactly what would have printed in real-time.
Visual Anchoring: To display both the current RSI and current MACD lines harmoniously in the same pane without skewing the scale, the MACD line is mathematically anchored to the RSI's 50-level (neutral line).
How to Read the Heatmap Dashboard
The dashboard is a 9-column by 3-row matrix located in the corner of your screen, covering timeframes from 1-minute to 1-Month.
Row 1 (RSI - Extreme Momentum): This row measures whether an asset is mathematically overbought or oversold.
🔴 Red (RSI >= 70): Overbought. The asset is extended to the upside in this specific timeframe.
🟢 Green (RSI <= 30): Oversold. The asset is extended to the downside.
⚫ Dark Gray (31-69): Neutral. The asset is flowing within normal momentum boundaries.
Row 2 (MACD - Trend Direction): This row measures the overarching trend control based on the MACD main line crossing the Zero line.
🟢 Green (MACD > 0): Bullish trend control.
🔴 Red (MACD < 0): Bearish trend control.
Practical Trading Application (Top-Down Analysis)
This tool excels at spotting high-probability continuation setups by aligning the macro-trend with micro-momentum pullbacks.
Example Setup (The Buy Dip): A trader observing a 5-minute chart looks at the dashboard. The MACD row shows Green for the 1H and 4H timeframes, indicating a strong macro bullish trend. However, the RSI row shows Green (< 30) for the 5m and 15m timeframes. This tells the trader that while the macro trend is up, there is short-term panic/oversold conditions. This alignment provides a mathematical, rules-based area to look for long entries (buying the dip) in the direction of the macro trend.
Key Features & Customization
Fully Customizable: You can change the lengths and smoothing periods for both the RSI and MACD.
Dashboard Positioning: Move the heatmap to any corner of the screen to fit your layout.
Decluttered Charting: By default, only the current timeframe's RSI and MACD lines are plotted, while all MTF data is neatly organized inside the heatmap.
Disclaimer: This indicator is for educational and analytical purposes only. It does not provide financial advice or guarantee profitable trades. Always combine momentum and trend indicators with proper risk management and price action analysis. 指標

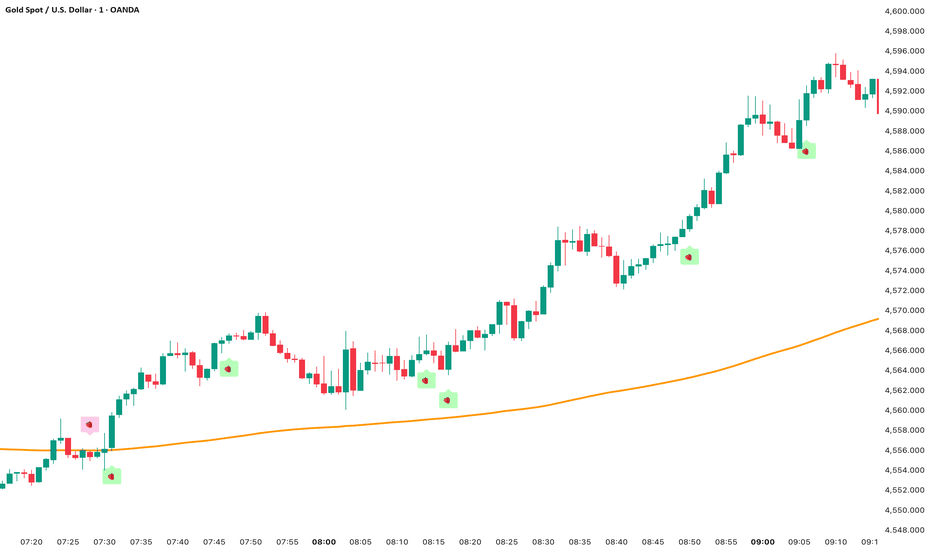
ADX/ MACD/ 200 EMA Strawberry Signals 🍓 Strawberry Signals 🍓
The Strawberry Signals indicator is a trend-following trading tool designed to help traders identify high-probability market entries by combining three core components:
trend direction (EMA 200), momentum (MACD), and trend strength (ADX) .
Signals are only displayed on confirmed candles to ensure stability and avoid repainting behavior.
📌 Indicator Concept
This indicator focuses on trading in the direction of the dominant trend. Instead of generating frequent signals, it filters out low-quality market conditions and only highlights setups where trend, momentum, and strength are aligned.
The goal is to reduce noise and help traders focus on clearer market structures rather than overtrading in sideways conditions.
📊 Core Components
1. EMA 200 – Trend Filter
The EMA 200 is used as the primary trend direction filter.
- Price above EMA 200 → bullish market structure
- Price below EMA 200 → bearish market structure
This ensures that signals are always aligned with the higher timeframe bias of the market.
2. MACD – Momentum Confirmation
The MACD crossover is used to confirm momentum shifts in the direction of the trend:
- Bullish signal: MACD line crosses above signal line
- Bearish signal: MACD line crosses below signal line
This helps identify moments where momentum supports the trend direction.
3. ADX – Trend Strength Filter
The ADX is used to measure whether the market is strong enough for trend trading.
Only when ADX is above the selected threshold (default: 20) will signals be allowed.
- Low ADX → weak or sideways market (no signals)
- High ADX → strong trend conditions (valid signals)
🟢 Buy Signal Conditions
Price is above the EMA 200
MACD line crosses above the signal line
ADX is above the defined threshold (trend strength confirmed)
Signal is confirmed on candle close (no intrabar signals)
🔴 Sell Signal Conditions
Price is below the EMA 200
MACD line crosses below the signal line
ADX is above the defined threshold (trend strength confirmed)
Signal is confirmed on candle close (no intrabar signals)
⚙️ Settings Overview
EMA Length: Defines the trend filter (default: 200)
MACD Settings: Controls momentum sensitivity (fast, slow, signal)
ADX Length: Smoothness of trend strength calculation
ADX Threshold: Minimum trend strength required for signals
📉 Market Conditions
This indicator performs best in trending environments where price moves directionally with momentum.
During sideways or low-volatility conditions, fewer signals will appear by design, as weak trends are filtered out.
👤 My Personal Use
This indicator is intentionally designed to produce fewer signals. Entries are only generated at the exact moment of a MACD crossover when all required conditions are aligned. I use it for XAUUSD on the 1M chart but I'm confident for it to work on different instruments.
In my personal trading, I also monitor situations where the ADX rises above the threshold after the MACD crossover. If momentum remains strong and the overall trend structure (EMA direction) is still valid, these scenarios can still offer interesting trade opportunities even if no signal was printed.
For better decision-making, I recommend displaying the MACD and ADX directly on the chart alongside this indicator. This helps to visually confirm momentum development for trading and trend strength beyond the signal itself.
⚠️ Important Notes
This indicator is designed for educational and analytical purposes.
It does not guarantee profitable trades.
Always combine signals with proper risk management and additional confirmation tools and market structure if needed.
🍓 Summary
Strawberry Signals provides a clean and structured approach to trend trading by combining multiple technical indicators into a single signal system.
It is built to reduce noise, filter weak setups, and highlight only high-quality trend-aligned opportunities directly on the chart.
指標
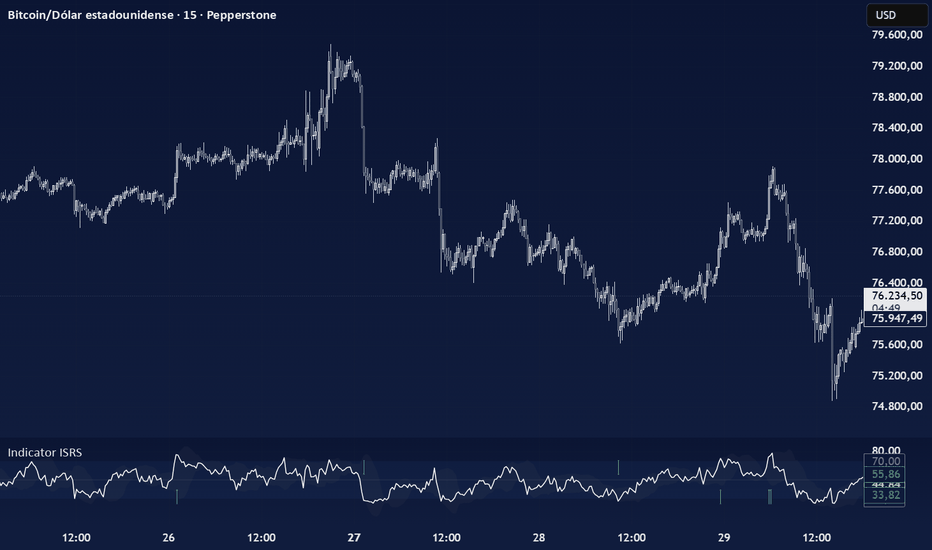
MACD + RSI + MFI + A/D by Ismael█ OVERVIEW
A 4-in-1 oscillator panel combining MACD, RSI with Bollinger Bands and
custom Buy/Sell signals, Money Flow Index (MFI), and Accumulation/Distribution.
Each module can be toggled on/off independently from a single "Toggle
Indicators" group, so the user can display only what they need instead of
loading four separate scripts.
═══════════════════════════════════════════════════════════════════════
█ ORIGINALITY
This script does not invent new math — it integrates four well-known
built-in indicators into a single pane and adds three conveniences:
- A unified toggle system to show/hide each indicator on demand.
- A custom RSI signal layer based on Bollinger Band breakouts of the
RSI itself, combined with the classic overbought/oversold zones.
- An A/D module that replicates the configuration style of the
MetaTrader 5 implementation (Tick/Real volume option and configurable
horizontal levels).
═══════════════════════════════════════════════════════════════════════
█ WHAT IT INCLUDES
▪ MACD (default: ON)
Standard MACD with configurable fast/slow lengths, signal smoothing,
and choice of SMA or EMA for both the oscillator and signal line.
Includes alerts for histogram polarity changes.
▪ RSI with Bollinger Bands and Buy/Sell signals (default: ON)
Classic RSI with optional smoothing MA (SMA, EMA, WMA, VWMA, SMMA,
or SMA + Bollinger Bands). When "SMA + Bollinger Bands" is selected:
- Buy signal: RSI closes below its lower Bollinger Band AND below 30.
- Sell signal: RSI closes above its upper Bollinger Band AND above 70.
Signals are plotted as arrows and include alert conditions.
▪ MFI (default: OFF)
Standard Money Flow Index with 80/50/20 horizontal levels.
▪ Accumulation/Distribution (default: OFF)
Classic cumulative A/D line. Configurable like the MT5 version:
- Volume mode: Real or Tick (1 per bar, useful for FX).
- 3 user-defined horizontal levels with individual visibility/color.
- Color and line width.
Includes alerts for crossovers against its own SMA(20).
═══════════════════════════════════════════════════════════════════════
█ HOW TO USE
1. Activate from "Toggle Indicators" only the modules you need.
2. RSI Buy/Sell signals are intended as confluence — not standalone
entries. They mark statistically rare conditions (extreme RSI combined
with a Bollinger Band breakout on the RSI) and should be confirmed
with price action, structure, or trend context.
3. MACD histogram polarity alerts can be paired with RSI signals.
4. The A/D line is most useful when watched for divergences against price,
not for its absolute value.
═══════════════════════════════════════════════════════════════════════
█ LIMITATIONS
- The A/D line uses cumulative values that produce very large numbers.
When combined with MACD/RSI/MFI in the same pane, auto-scale will
compress the smaller-range indicators. Workaround: right-click the
A/D plot → "Pin to scale" → assign it to a separate scale.
- "Tick" volume here is approximated as 1 per bar; Pine Script does not
expose the tick-volume data used by MetaTrader 5. For instruments with
reliable real volume, use "Real".
- RSI Buy/Sell signals only fire when the smoothing MA type is set to
"SMA + Bollinger Bands". Other MA types disable the signal layer.
- This is an aggregator/utility script. It does not predict market
direction and is not a complete trading system.
═══════════════════════════════════════════════════════════════════════
█ DISCLAIMER
This script is shared for educational purposes only and is not financial
advice. Indicator signals do not guarantee future results. Always perform
your own analysis and apply proper risk management.
═══════════════════════════════════════════════════════════════════════
█ DESCRIPCIÓN (Español)
Panel de osciladores 4-en-1 que combina MACD, RSI con Bandas de Bollinger
y señales de compra/venta, MFI y Acumulación/Distribución. Cada módulo se
activa o desactiva de forma independiente desde el grupo "Toggle
Indicators".
Incluye:
- MACD estándar con alertas de cambio de polaridad del histograma.
- RSI con MA opcional (SMA, EMA, WMA, VWMA, SMMA o SMA+BB). Cuando
se elige "SMA + Bandas de Bollinger", aparecen señales:
- Compra: RSI por debajo de la banda inferior Y menor a 30.
- Venta: RSI por encima de la banda superior Y mayor a 70.
- MFI estándar con niveles 80/50/20.
- Acumulación/Distribución estilo MT5: volumen Real/Tick, 3 niveles
horizontales configurables, color y grosor ajustables, alertas de
cruce contra su SMA(20).
Las señales del RSI son herramientas de confluencia, no entradas
automáticas. La línea A/D se interpreta principalmente por divergencias
con el precio, no por su valor absoluto. Al activar A/D junto con los
demás osciladores, conviene moverla a una escala separada (clic derecho
sobre la línea → "Fijar a escala" → escala nueva).
Este script tiene fines educativos. No constituye asesoría financiera.
█ HOW TO USE
The RSI Buy/Sell signals (with their attached alerts) are the main
actionable element of this script and can be used to anticipate potential
entries — long on Buy signals, short on Sell signals. They fire under
statistically rare conditions (RSI breaking out of its own Bollinger Band
envelope while also being in extreme oversold/overbought territory),
which often precede a reversion or a meaningful move.
However, these signals should NOT be taken as standalone entries. They
work best as an early-warning system that must be confirmed before
acting on them. Recommended workflow:
1. RSI Buy/Sell signal fires → set alert and prepare the trade idea.
2. Look at the MACD for confirmation:
- For a Buy: histogram should be turning from falling to rising,
or MACD line crossing above Signal.
- For a Sell: histogram turning from rising to falling, or MACD
line crossing below Signal.
3. Check the MFI (if enabled): values pulling back from oversold (<20)
on Buys, or pulling back from overbought (>80) on Sells, add
confluence by confirming a money-flow shift.
4. Check the A/D line for divergences with price:
- Bullish divergence (price makes lower low, A/D makes higher low)
strongly supports a Buy signal.
- Bearish divergence (price makes higher high, A/D makes lower
high) strongly supports a Sell signal.
Divergences on RSI itself against price work the same way and are
one of the most reliable confirmation tools in this panel.
5. Always combine with price-action context: trend direction on higher
timeframes, key support/resistance, and your own risk management.
In short: the RSI signals are designed to ANTICIPATE trades, not to
trigger them automatically. The other modules (MACD, MFI, A/D) and
divergence analysis exist to filter the false positives and validate
the ones worth taking.
═══════════════════════════════════════════════════════════════════════
█ CÓMO USAR (Español)
Las señales de Compra/Venta del RSI (con sus alertas configuradas) son
el elemento principal accionable de este script y pueden usarse para
anticipar entradas — largos en señales de Compra, cortos en señales de
Venta. Se activan en condiciones estadísticamente poco frecuentes
(el RSI rompe su propia envolvente de Bandas de Bollinger mientras
está en zona de sobreventa o sobrecompra extrema), que suelen preceder
una reversión o un movimiento significativo.
Sin embargo, NO deben tomarse como entradas automáticas. Funcionan
mejor como un sistema de alerta temprana que debe confirmarse antes
de operar. Flujo recomendado:
1. Se dispara la señal del RSI → preparar la idea de trade.
2. Confirmar con MACD:
- Compra: histograma pasando de bajista a alcista, o cruce
del MACD por encima de la Signal.
- Venta: histograma pasando de alcista a bajista, o cruce
del MACD por debajo de la Signal.
3. Confirmar con MFI (si está activo): valores saliendo de
sobreventa (<20) en Compras o saliendo de sobrecompra (>80)
en Ventas indican un cambio en el flujo de dinero.
4. Buscar divergencias en la línea A/D contra el precio:
- Divergencia alcista (precio hace mínimo más bajo, A/D hace
mínimo más alto) refuerza una señal de Compra.
- Divergencia bajista (precio hace máximo más alto, A/D hace
máximo más bajo) refuerza una señal de Venta.
Las divergencias del propio RSI contra el precio funcionan igual
y son una de las confirmaciones más fiables de este panel.
5. Siempre combinar con contexto de price action: tendencia en
temporalidades superiores, soportes/resistencias clave y gestión
de riesgo propia.
En resumen: las señales del RSI están diseñadas para ANTICIPAR
trades, no para dispararlos automáticamente. Los otros módulos
(MACD, MFI, A/D) y el análisis de divergencias existen para filtrar
los falsos positivos y validar las entradas que realmente valen
la pena. 指標
指標
指標
SwissTradeAcademy Money PrinterThe SwissTradeAcademy Money Printer is a professional-grade, multi-component trading indicator developed in Pine Script v6. It combines three powerful analysis methodologies into a single, high-performance tool, designed to keep your TradingView charts clean while providing comprehensive market insights.
Core Components
1. Super Bollinger Trend (SBT)
A dynamic trend-following system based on Bollinger Band volatility.
Trend Tracking: Uses an adaptive baseline that shifts based on price action and volatility.
Integrated ZigZag: Automatically identifies and connects local highs and lows to visualize market structure.
Signal Labels: Provides clear visual markers for trend shifts and price targets.
2. MACD Price Overlay
Unlike standard oscillators that sit in a separate pane, this MACD is projected directly onto the price chart.
Trend Momentum: Features a dual-line MACD (Fast/Slow) and a Signal line that change color based on momentum direction.
Visual Fill: Uses a dynamic color cloud to represent the gap between the MACD and Signal lines, highlighting bullish and bearish strength.
SMA 89 Filter: Includes a long-term 89-period Simple Moving Average to identify the "Golden Mean" and primary market direction.
3. 4-in-1 Multi-Timeframe MAs
A flexible Moving Average engine that allows for deep customization.
Versatile Types: Choose from SMA, EMA, WMA, RMA, HMA, or VWMA.
Multi-Timeframe (MTF) Support: Plot MAs from higher timeframes (e.g., 1H or Daily) directly onto your current lower-timeframe chart.
Custom Sources: Calculate averages based on Open, High, Low, Close, or HL2.
Key Features
Pine Script v6 Optimized: Built with the latest TradingView standards for maximum execution speed and reliability.
Organized Settings: All parameters are logically grouped in the "Inputs" tab for easy configuration.
Clean Interface: Combines three indicators into one, saving valuable indicator slots for free-tier users and reducing chart clutter.
How to Use
Trend Confirmation: Look for alignment between the Super Bollinger Trend color and the MACD cloud color.
Support & Resistance: Use the 89 SMA and the 200 EMA (MA 1) as major "institutional" levels for trade entries or exits.
Volatility Alerts: The ZigZag labels help track the distance of moves, assisting in setting realistic Take Profit levels. 指標

指標
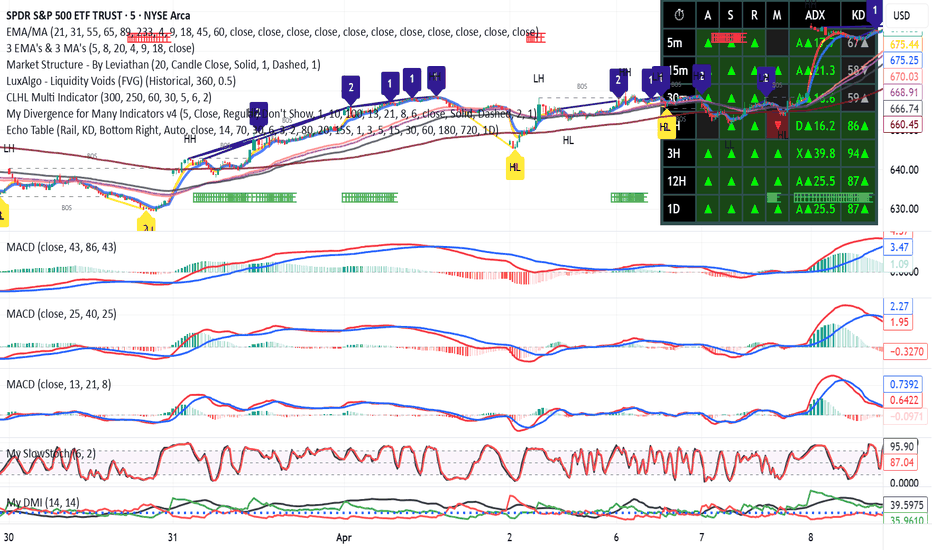
MACD + 200 EMA + Support/Resistance Strategy This open-source strategy is an educational Pine Script implementation of a MACD + 200 EMA + support/resistance trading concept.
It was created to convert a visually explained strategy idea into clear, testable rules, so traders can study how the logic behaves under backtesting conditions.
The strategy combines three main components:
1. MACD momentum logic
2. A 200 EMA trend filter
3. A pivot-based support and resistance filter
For long setups, the strategy looks for a bullish MACD crossover below the zero line, while price is above the 200 EMA.
For short setups, the strategy looks for a bearish MACD crossover above the zero line, while price is below the 200 EMA.
A support and resistance filter can also be enabled. This filter uses confirmed pivot levels, wick-based touches, ATR-based tolerance, and a maximum level age to create a more objective interpretation of support and resistance behavior.
Main features:
- MACD default settings
- 200 EMA trend filter
- Optional pivot-based support and resistance filter
- Confirmed pivots only
- Wick-based touch detection
- ATR-based tolerance
- Long and short logic
- Multiple stop-loss modes
- Risk/reward based take-profit logic
- Optional pyramiding controls
- Strategy backtesting support
Stop-loss logic:
The script includes more than one stop-loss interpretation because the original concept does not define the stop placement with full precision.
Stop option 1:
A stop placed above or below the 200 EMA by a user-defined number of ticks.
Stop option 2:
A stop placed at the nearest valid swing within a user-defined lookback window. If no valid swing is found, the script falls back to the EMA-based stop.
Take-profit logic:
The take-profit target is calculated using a fixed risk/reward multiple based on the distance between entry and stop-loss.
Default risk/reward:
1.5R
Execution assumptions:
- Entries are placed on the next candle open after the signal bar.
- Exits are handled through stop-loss and take-profit only.
- MACD is calculated on close.
- EMA is calculated on close.
- Support and resistance levels are based on confirmed pivots only.
- The strategy is designed for educational backtesting and research, not for automatic live trading.
Important backtesting notes:
Backtest results can vary significantly depending on the symbol, timeframe, commission, slippage, spread, data provider, and strategy settings.
Users should always adjust commission and slippage settings to match the market being tested. A zero-cost setup may produce unrealistic results.
This script does not guarantee profitability, future performance, or a specific win rate.
This is not the original creator’s code. It is a testable logical interpretation of the strategy idea, built by converting unclear visual rules into explicit Pine Script conditions.
If you believe a different interpretation of the unclear parts would be more accurate, you can modify the open-source code and test your own version.
Disclaimer:
This script is provided for educational and research purposes only. It is not financial advice, investment advice, or a recommendation to buy, sell, short, or trade any asset.
Trading involves risk. Past performance and backtested results do not guarantee future results. Always do your own research and test thoroughly before using any strategy in live market conditions.
No strategy, indicator, or backtest can guarantee profits or eliminate trading risk. 策略

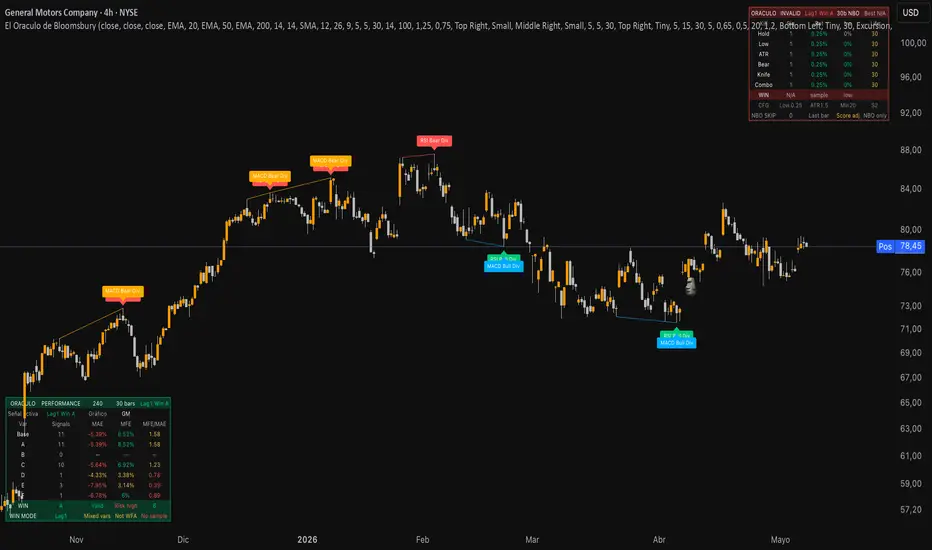
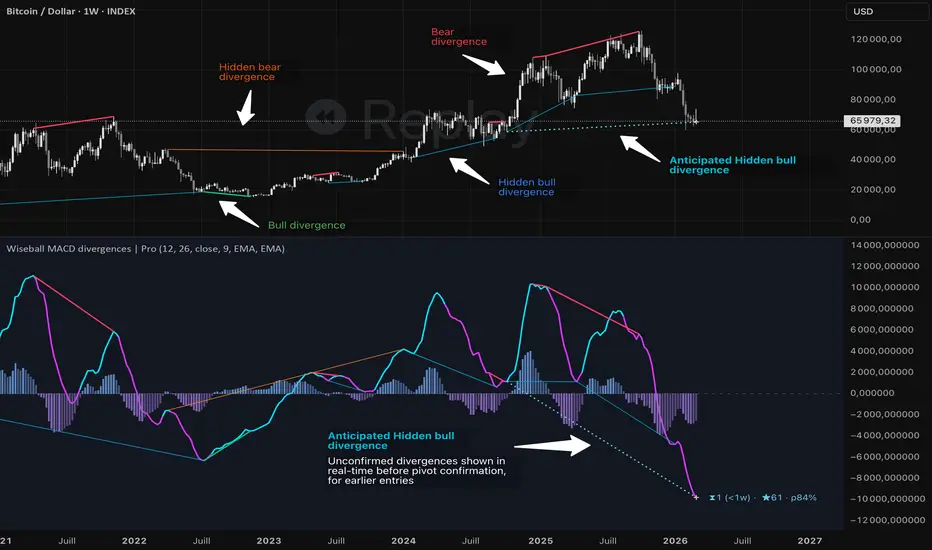
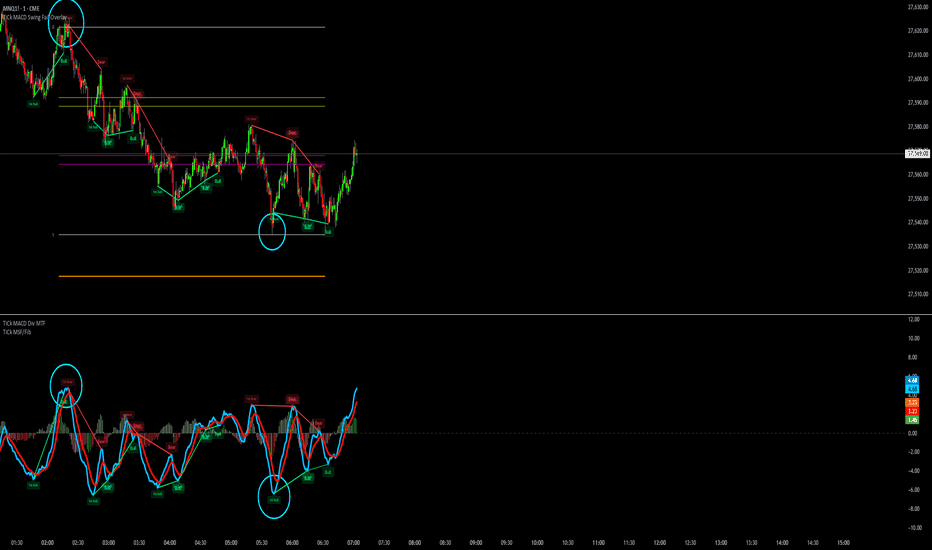
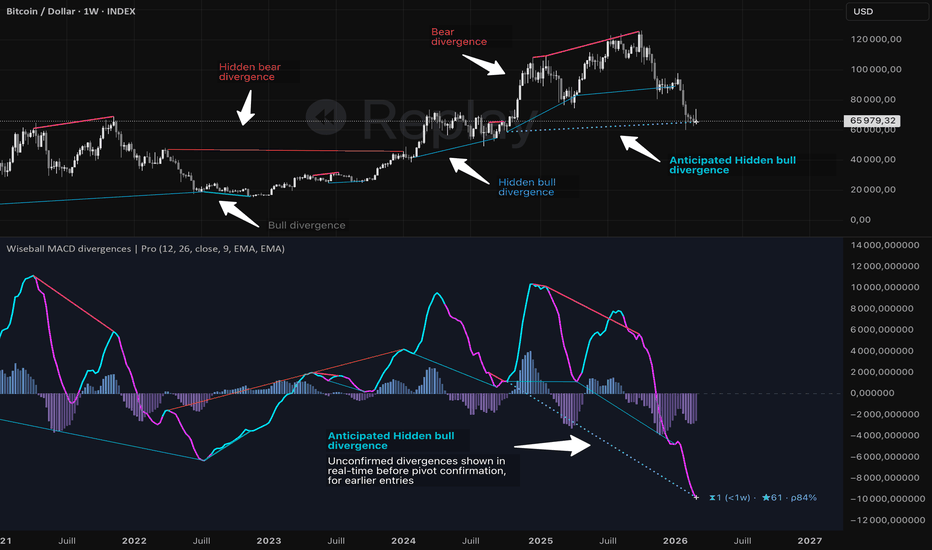
MACD Divergences, Quality Scored & Anticipated [wiseball]Wiseball MACD Divergences | Pro — Precision divergence detection on the classic MACD.
A focused divergence engine built around the MACD — combining quality scoring, anticipated signals, projected signals, and configurable filtering.
What sets it apart:
Quality-scored divergences — every signal gets a 0–100 rank, so you can filter noise instead of drowning in it
Anticipated divergences with live probability — catch divergences before pivot confirmation, with a statistical confidence score
Webhook-ready alerts gated by quality score and probability — built for serious automation, not just pop-ups
Headline features:
Quality-scored divergences (0–100) — each divergence is ranked by a composite quality score, normalized for cross-market comparability
Anticipated divergences — unconfirmed divergences shown in real-time before pivot confirmation, for earlier entries
Probability of confirmation — each anticipated divergence displays a live probability score, computed from a statistical model built on historical divergence outcomes (amplitude, duration and pivot age)
Projected divergences — an additional early-warning class for crossed oscillator lines, extended 15 bars forward
Divergences on the price chart — MACD divergences plotted in overlay mode at actual price pivots
OB/OS zone filtering — restrict divergences to oscillator extreme zones only
MACD settings:
Configurable fast length, slow length, signal smoothing and price source (Close, HLC3, and more)
Oscillator MA type: SMA or EMA for both MACD line and signal line
Histogram with dynamic growth/fall coloring above and below the zero line
Dual OB/OS levels on the MACD scale
Signals & visuals:
Regular and Hidden divergences
Anticipated & Projected divergences with info labels (countdown, score, probability)
Buy / Sell bullet signals at OB/OS extremes
MACD line, signal line and histogram with perceptually-consistent coloring
Zero-line reference for momentum context
Perceptually-consistent color palette unified with the TradingView dark theme
Smart filtering:
Quality score threshold — filter out divergences below a chosen score
Best-score filter mode — keep only the highest-scored divergence when several overlap
Crossing & range filters with three readability modes (downplay / delete / off)
Configurable min/max divergence duration
Alerts:
Rich alert payload including ticker, timeframe, divergence type, score, and probability — formatted for webhook consumption
Quality-score gating — alerts trigger only when the divergence meets the configured score threshold
Probability gating — anticipated divergence alerts trigger only above a configured probability threshold
Full alert set: regular, hidden, and anticipated divergences in both directions
Dedicated OB/OS signal alerts (oversold bull, overbought bear)
Histogram state-change alerts (rising to falling, falling to rising)
Technical details:
Standard MACD calculation (fast EMA − slow EMA, signal = EMA of MACD)
Analyzes up to 4000 bars of history and tracks up to 450 simultaneous divergences
Configurable pivot lookback (left/right bars)
Pivot offset tolerance for price/oscillator alignment
Overtaking modes (Lazy / Advanced) with percentage tolerance
How to use:
Trend-following and momentum confirmation
Reversal and exhaustion detection on the MACD
OB/OS divergence entries combined with a quality threshold
Trade confirmation alongside other oscillators
Webhook-based automation using the structured alert payload
Part of the Wiseball Pro suite
Companion Pro versions exist for RSI, WaveTrend (with multi-oscillator confluence), Stochastic RSI, MFI and others — search "Wiseball" on TradingView.
Disclaimer: As with all trading tools, this indicator should be used alongside other forms of analysis and your own judgment. It provides analytical insights, not predictions. Past signals do not guarantee future performance. Always conduct your own research and trade responsibly.
指標
指標
指標

指標
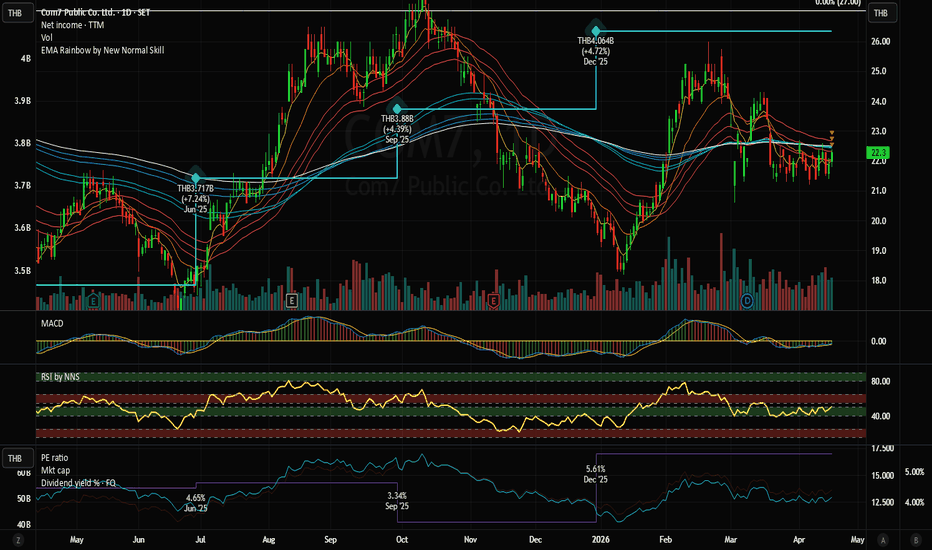
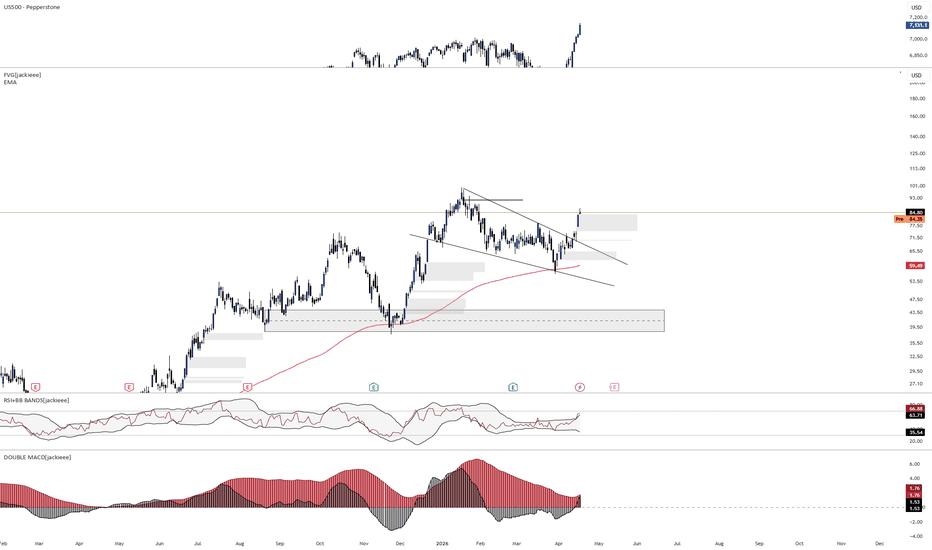
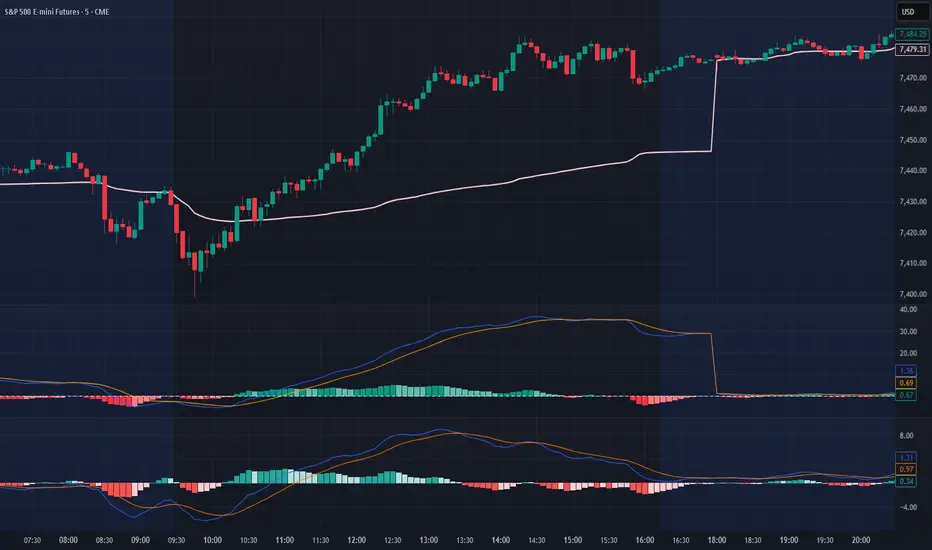
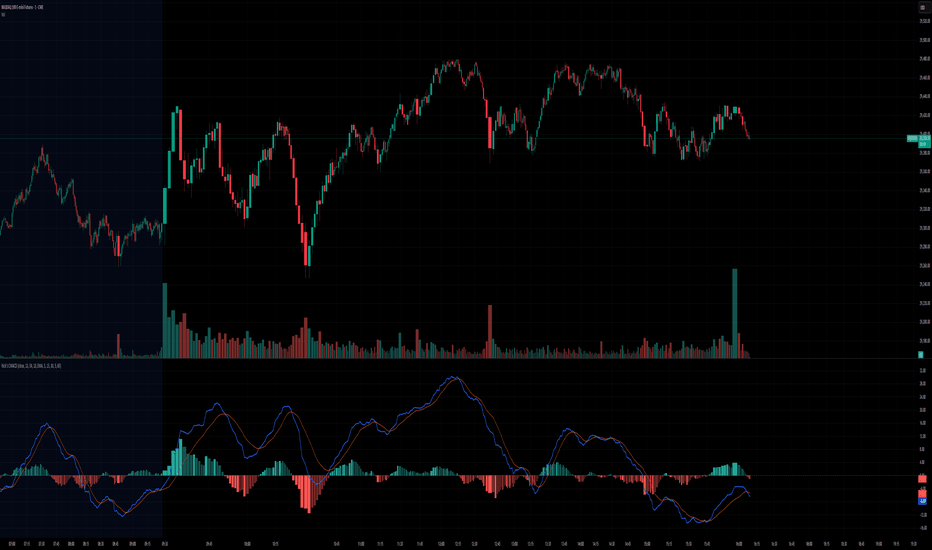
DOUBLE MACD[jackieee]Description
This is a double MACD indicator based on the default MACD, designed to help identify both the higher-timeframe trend and the lower-timeframe rhythm at the same time.
The first MACD is recommended to be set to 55, 89, 1, and is used to identify the main trend on the higher timeframe. The second MACD is recommended to be set to 13, 21, 1, and is used to identify pullbacks within the larger trend, or smaller trend movements on the lower level.
In practice, the first MACD can be used to define the overall market direction, while the second MACD helps track whether a pullback is ending and whether a continuation opportunity is forming. This makes it easier to read both the larger trend and the smaller price rhythm within the same framework.
Reminder
please open the indicator style settings and untick the top “plot” line, otherwise an extra price line will appear and may affect chart readability. 指標